Date: Fri Feb 21 2014 - 16:33:38 MST
Hi Cheryl,
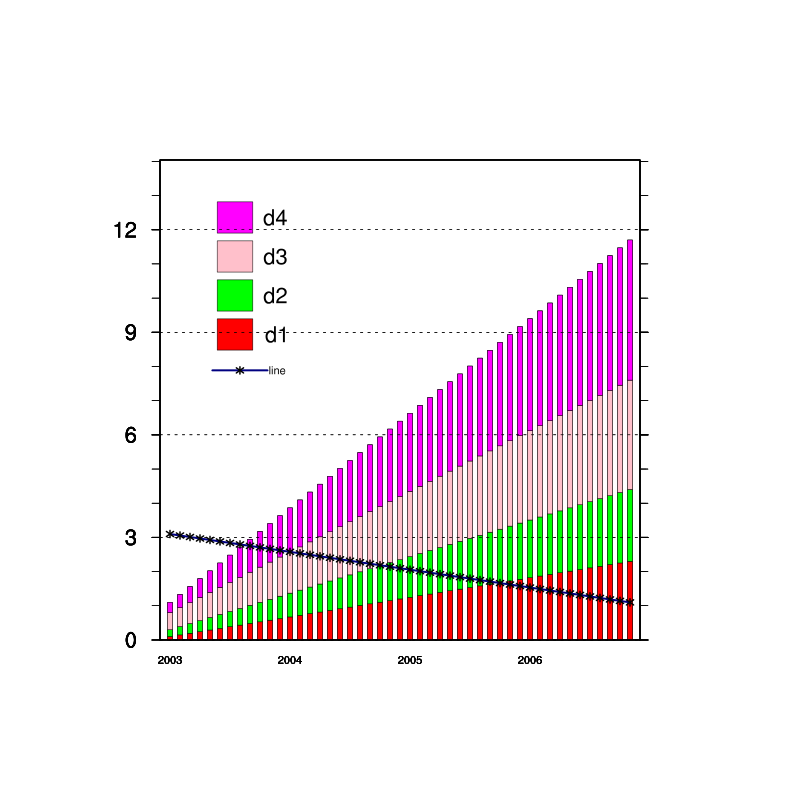
I think following Adam's first set of suggestions could be more easier.
Following these, I have created a figure similar to that you had attached
with your previous email. (I used dummy data for this).
The script and the figure are attached herewith.
Cheers
Rashed
------------------------------------------
Date: Fri, 21 Feb 2014 13:41:12 -0700
From: Adam Phillips <asphilli@ucar.edu>
Subject: Re: how to make filled curves on xy ploys?
To: cheryl Ma <xiaoyancloud@gmail.com>, "ncl-talk@ucar.edu USERS"
<ncl-talk@ucar.edu>
Message-ID: <5307B9E8.1010003@ucar.edu>
Content-Type: text/plain; charset="iso-8859-1"
Hi Cheryl,
Take a look at the bar chart examples here:
http://www.ncl.ucar.edu/Applications/bar.shtml
Specifically #14 and #16.. #14 shows you how to overlay a XY plot on a
bar chart plot. Example #16 shows how to create a stacked bar chart.
Combining those two examples is one way to go.
Another way would be to draw the red bars, then overlay the yellow bars,
then overlay the green, then lighter blue, then dark blue, then add the
timeseries. You could do all this by creating numerous plots and then
using the overlay procedure.
(http://www.ncl.ucar.edu/Document/Functions/Built-in/overlay.shtml) Note
that in this case the red bars would need to be technically the sum of
all the bars, the yellow bars would be the sum of (dark blue+light blue
+ green+yellow), and so on.
See xy_32.ncl at the bottom of the overlay examples page here:
http://www.ncl.ucar.edu/Applications/overlay.shtml#xy_32
to see overlay being used in a similar way to how you would need to use it.
Hope all of that helps.
Good luck,
Adam
On 02/21/2014 12:30 PM, cheryl Ma wrote:
> Hi all,
>
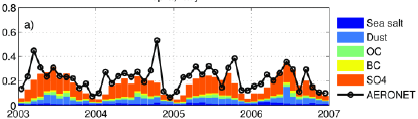
> I want to make a plot like the attached one, It is easy to make the
> black curve using XY plot, the question is how to add the filled
> curves? Can anybody direct me where to find an example?
> Thanks in advance.
>
>
> Inline image 2
>
>
> _______________________________________________
> ncl-talk mailing list
> List instructions, subscriber options, unsubscribe:
> http://mailman.ucar.edu/mailman/listinfo/ncl-talk
--
______________________________________________________________
Adam Phillips                                asphilli@ucar.edu
NCAR/Climate and Global Dynamics Division       (303) 497-1726
P.O. Box 3000
Boulder, CO 80307-3000    http://www.cgd.ucar.edu/staff/asphilli
-------------- next part --------------
An HTML attachment was scrubbed...
URL:
http://mailman.ucar.edu/pipermail/ncl-talk/attachments/20140221/8c1fd477/attachment.html
-------------- next part --------------
A non-text attachment was scrubbed...
Name: not available
Type: image/png
Size: 27433 bytes
Desc: not available
Url :
http://mailman.ucar.edu/pipermail/ncl-talk/attachments/20140221/8c1fd477/attachment.png
_______________________________________________
ncl-talk mailing list
List instructions, subscriber options, unsubscribe:
http://mailman.ucar.edu/mailman/listinfo/ncl-talk
- application/octet-stream attachment: bar_exp.ncl