Date: Mon Jul 02 2012 - 15:29:43 MDT
Hi Mary,
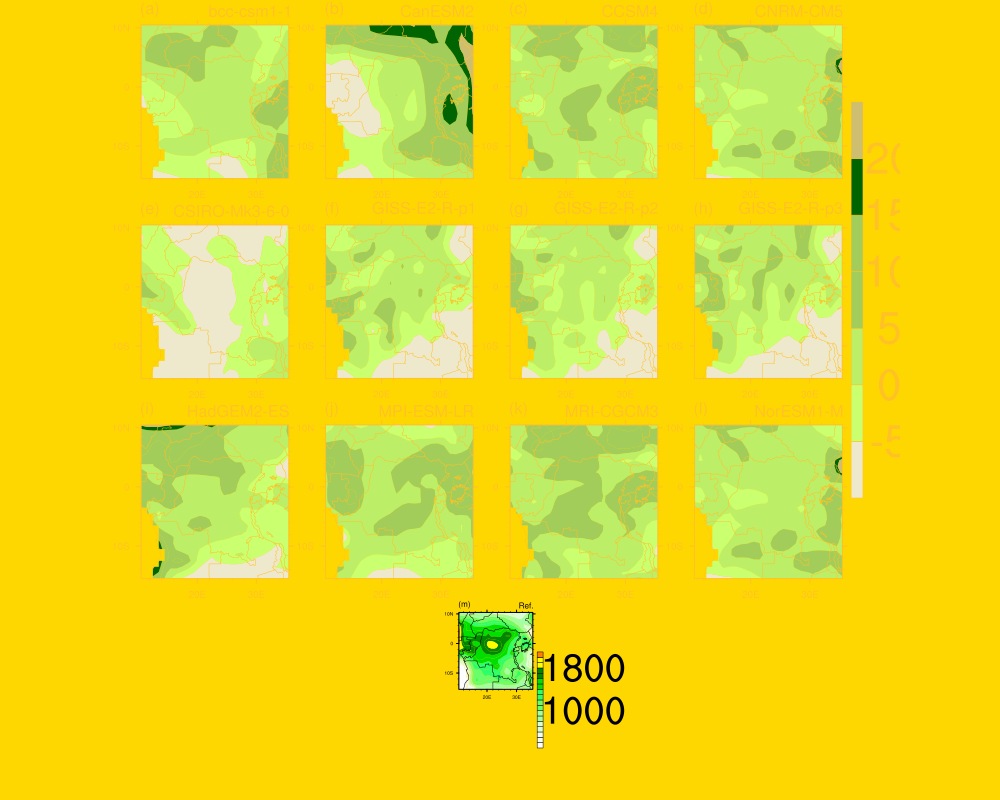
Following the panel plot examples (15), I created a panel plot with 13
figures. I am able to create two different legends for two sets of graphs,
but the figure doesn't look quite ok yet! The panel plot I created is
attached (panelplot1.png).
The following needs to defined/fixed in the plot. I will appreciate your
help on this,
1. change the background color to white/transparent
2. adjust the legend font size
3. maximize the lower panel plot size to match with the upper panel
I have attached appended the relevant code section below,
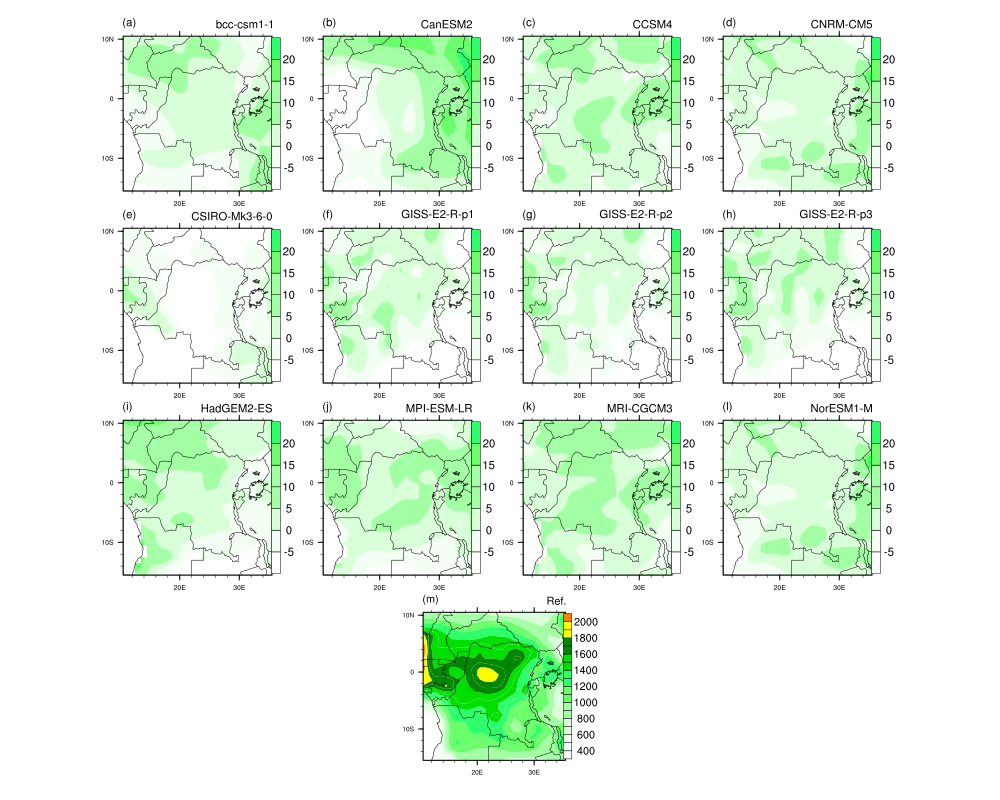
I want to make panleplot1 look like panelplot2.png with the new legends.
Thank you in advance for your help.
Noel
;***************************************************************************************************************************
type = "png"
wks = gsn_open_wks(type, diro +
"annual_precip_change_AllGCMs_2021-2050_circa")
plot = new(12, graphic)
;colors1 = namedcolor2rgb ((/
"cornsilk1","cornsilk2","palegreen1","palegreen2","palegreen3","chartreuse4","darkgreen",
\
;
"gold1","goldenrod1","darkorange","darkorange3" /))
colors2 = namedcolor2rgb ((/
"gold1","goldenrod1","cornsilk2","darkolivegreen1","darkolivegreen2", \
"darkolivegreen3","darkgreen","lightgoldenrod3" /))
colors1 = (/ (/255,255,255/),(/0,0,0/),(/255,255,255/), (/244,255,244/), \
(/217,255,217/), (/163,255,163/), (/106,255,106/), \
(/43,255,106/), (/0,224,0/), (/0,134,0/),(/255,255,0/),\
(/255,127,0/) /) * 1.0 / 255.
gsn_define_colormap(wks, colors2)
centerlon = (regBnds(ireg,2) + regBnds(ireg,3)) / 2 ; center the map
around this longitude
;------------- resource list for 1st plot
res1 = True
res1@gsnDraw = False
res1@gsnFrame = False
res1@gsnPaperOrientation = "auto"
res1@gsnMaximize = True
res1@gsnStringFontHeightF = 0.0125
res1@gsnSpreadColors = True
res1@gsnRightStringFontHeightF = 0.04
res1@gsnLeftStringFontHeightF = 0.04
res1@gsnSpreadColors = True ; not needed in NCL v6.1.0
res1@lbLabelBarOn = False
res1@lbOrientation = "Vertical"
res1@lbLabelFontHeightF = 0.04
res1@pmLabelBarOrthogonalPosF = -0.025
res1@lbLabelAutoStride = True
res1@cnFillOn = True
res1@cnLinesOn = False
res1@cnLineLabelsOn = False
res1@mpCenterLonF = centerlon ; center the map
arounf this lon.
res1@mpMinLatF = regBnds(ireg,0) ; select a
subregion
res1@mpMaxLatF = regBnds(ireg,1)
res1@mpMinLonF = regBnds(ireg,2)
res1@mpMaxLonF = regBnds(ireg,3)
res1@gsnAddCyclic = False
res1@mpFillOn = False
res1@mpOutlineBoundarySets = "National"
res1@mpPerimOn = True
res1@mpDataBaseVersion = "MediumRes"
res1@mpDataSetName = "Earth..4"
res1@mpOceanFillColor = 1
do i=0,11
res1@cnLevelSelectionMode = "ExplicitLevels"
res1@cnLevels = (/-5,0,5,10,15,20/)
res1@gsnRightString = gcm_names(i)
res1@gsnLeftString = plot_id(i)
; advance the plot
plot(i) = gsn_csm_contour_map_ce(wks,Pdiff_ann2150(0,i,:,:), res1)
end do
pres1 = True ; Set panel resources.
pres1@gsnPanelLabelBar = True ; Turn on panel labelbar.
pres1@gsnFrame = False ; do not advance the frame
pres1@lbOrientation = "vertical"
pres1@lbLabelAutoStride = True
pres1@lbLabelFontHeightF = 0.04
pres1@gsnPanelBottom = 0.25 ; restrict plot to upper 0.75 of
page
pres1@gsnPanelRowSpec = True ; tell panel what order to plot
pres1@gsnPanelCenter = True ; centered plot
;pres1@gsnMaximize = True
gsn_panel(wks,plot,(/4,4,4/),pres1)
delete([/res1@cnLevels,pres1/])
gsn_define_colormap(wks, colors1)
res1@cnLevelSelectionMode = "ManualLevels"
res1@cnMinLevelValF = 400.
res1@cnMaxLevelValF = 2000.
res1@cnLevelSpacingF = 100
res1@gsnRightString = "Ref."
res1@gsnLeftString = plot_id(12)
plot2 = gsn_csm_contour_map_ce(wks,Pann7100_obs,res1)
; advance to panel resources
pres2 = True ; Set panel resources.
pres2@gsnPanelLabelBar = True ; Turn on panel labelbar.
pres2@gsnPanelTop = 0.25
;pres2@gsnPanelBottom = 0.
pres2@gsnFrame = False ; do not advance the frame
pres2@lbOrientation = "vertical"
pres1@lbLabelFontHeightF = 0.04
pres2@gsnPanelRowSpec = True ; tell panel what order to plot
pres2@gsnPanelCenter = True ; centered plot
pres2@gsnMaximize = True
gsn_panel(wks,plot2,(/1,1/),pres2)
frame(wks)
delete([/type,res1,pres2,wks,plot,plot2,colors1,colors2/])
;***************************************************************************************************
Noel Aloysius
On Fri, Jun 29, 2012 at 10:13 AM, Mary Haley <haley@ucar.edu> wrote:
>
> On Jun 28, 2012, at 6:06 PM, Noel Aloysius wrote:
>
> > Hi NCL,
> >
> > I created a panel plot with 16 plots (figure attached). I want to
> >
> > (a) include a single legend for the first three rows and the same legend
> for the first two plots in the last row
>
> Hi Noel,
>
> We have a few examples that show how to panel multiple plots using
> different legends (we call them labelbars).
>
> See examples 15, 17, 22, and 26.
>
> http://www.ncl.ucar.edu/Applications/panel.shtml
>
>
> >
> > (b) change the colormap for the last two plot in the last row to a
> different color scheme.
>
> Example 26 in the above URL uses three different color maps. You need to
> have V6.1.0-beta
> to create this type of example, though.
>
> If you don't have V6.1.0-beta, then the best way to use multiple color
> tables on one page
> is to merge two color maps using gsn_merge_colormaps.
>
> You then will need to set gsnSpreadColorStart and gsnSpreadColorEnd for
> each set
> of plots to indicate where the first color map starts and ends, and same
> for the second
> colormap.
>
> See example 9 at:
>
> http://www.ncl.ucar.edu/Applications/color.shtml
>
> which shows how to change the color map *and* panel the two different
> plots.
>
>
>
> >
> > (c) I get a warning message after each plot as below,
> >
> > warning:DataSetName is not a valid resource in xxxx_contour at this time
> <- not sure why I get this?
>
> Whenever you see this type of error, "not a valid resource...", it usually
> means you've misspelled a resource
> name, or are applying a resource to the wrong function. In this case, it
> is misspelled. It should be "mpDataSetName".
>
> Hope this helps.
>
> --Mary
>
> >
> > My attempts so far have not yielded the required results.
> >
> > I appreciate you help on this. The portion of the script is appended
> below,
> >
> > ;*******************************************************************
> > wks = gsn_open_wks("png", diro + "annualAvg_precip_AllGCMs_1971-2000")
> > plot = new(16, graphic)
> >
> > colors = (/ (/255,255,255/),(/0,0,0/),(/255,255,255/),
> (/244,255,244/), \
> > (/217,255,217/), (/163,255,163/), (/106,255,106/), \
> > (/43,255,106/), (/0,224,0/), (/0,134,0/),(/255,255,0/),\
> > (/255,127,0/) /) * 1.0
> > colors = colors/255.
> > gsn_define_colormap(wks, colors)
> >
> > centerlon = (regBnds(ireg,2) + regBnds(ireg,3)) / 2 ; center the map
> around this longitude
> >
> > ;------------- resource list for 1st plot
> > res1 = True
> > res1@gsnDraw = False
> > res1@gsnFrame = False
> > res1@gsnPaperOrientation = "auto"
> > res1@gsnMaximize = True
> > res1@gsnStringFontHeightF = 0.0125
> > res1@gsnSpreadColors = True
> >
> > res1@lbOrientation = "Vertical"
> > res1@lbLabelFontHeightF = 0.03
> > res1@pmLabelBarOrthogonalPosF = -0.025
> > res1@lbLabelAutoStride = True
> > res1@gsnSpreadColors = True
> > res1@cnFillOn = True
> > res1@cnLinesOn = False
> > res1@cnLineLabelsOn = False
> >
> > res1@mpCenterLonF = centerlon ; center
> the map around this lon.
> > res1@mpMinLatF = regBnds(ireg,0) ; select a
> subregion
> > res1@mpMaxLatF = regBnds(ireg,1)
> > res1@mpMinLonF = regBnds(ireg,2)
> > res1@mpMaxLonF = regBnds(ireg,3)
> > res1@gsnAddCyclic = False
> >
> > res1@mpFillOn = False
> > res1@mpOutlineBoundarySets = "National"
> > res1@mpPerimOn = True
> > res1@mpDataBaseVersion = "MediumRes"
> > res1@DataSetName = "Earth..4"
> > res1@mpOceanFillColor = 1
> >
> > do i=0,11
> > res1@cnLevelSelectionMode = "ManualLevels"
> > res1@cnMinLevelValF = 600
> > res1@cnMaxLevelValF = 2400
> > res1@cnLevelSpacingF = 100
> > res1@gsnRightStringFontHeightF = 0.03
> > res1@gsnRightString = gcm_names(i)
> > ; advance the plot
> > plot(i) = gsn_csm_contour_map_ce(wks,Pann7100(0,i,:,:), res1)
> > end do
> >
> > res1@gsnRightString = "Obs"
> > res1@gsnRightStringFontHeightF = 0.03
> > plot(12) = gsn_csm_contour_map_ce(wks,Pann7100_obs,res1)
> >
> > res1@gsnRightString = "bias-corr. GCM-avg"
> > plot(13) = gsn_csm_contour_map_ce(wks,Pannstats_bc(0,:,:),res1)
> >
> > delete([/res1@cnLevelSelectionMode,res1@cnMinLevelValF
> ,res1@cnMaxLevelValF,res1@cnLevelSpacingF/])
> > delete(res1@cnLevels)
> > res1@cnLevelSelectionMode = "ExplicitLevels"
> > res1@cnLevels = (/5,10,15,20,25,30,35,40/)
> > res1@gsnRightString = "CV"
> > res1@gsnRightStringFontHeightF = 0.03
> > plot(14) = gsn_csm_contour_map_ce(wks,Pannstats_bc(1,:,:),res1)
> >
> > delete(res1@cnLevels)
> > delete([/res1@cnLevelSelectionMode,res1@cnMinLevelValF
> ,res1@cnMaxLevelValF,res1@cnLevelSpacingF/])
> > res1@cnLevelSelectionMode = "ExplicitLevels"
> > res1@cnLevels =
> (/-1.0,-0.8,-0.6,-0.4,-0.2,0,0.2,0.4,0.6,0.8,1.0/)
> > res1@gsnRightString = "skew"
> > res1@gsnRightStringFontHeightF = 0.03
> > plot(15) = gsn_csm_contour_map_ce(wks,Pannstats_bc(2,:,:),res1)
> >
> > ; advance to panel resources
> > pres = True ; Set panel resources.
> > pres@gsnPanelLabelBar = False ; Turn on panel labelbar.
> > pres@gsnFrame = False ; do not advance the frame
> > pres@gsnPanelRowSpec = True ; tell panel what order to
> plot
> > pres@gsnPanelCenter = False ; left-ligned plot
> > pres@gsnMaximize = True
> > gsn_panel(wks,plot,(/4,4,4,4/),pres)
> >
> > frame(wks)
> > delete([/res1,pres,wks,plot/])
> >
> ;*************************************************************************************************************
> >
> >
> > Noel
> >
> <annualAvg_precip_AllGCMs_1971-2000.png>_______________________________________________
> > ncl-talk mailing list
> > List instructions, subscriber options, unsubscribe:
> > http://mailman.ucar.edu/mailman/listinfo/ncl-talk
>
>
_______________________________________________
ncl-talk mailing list
List instructions, subscriber options, unsubscribe:
http://mailman.ucar.edu/mailman/listinfo/ncl-talk