‘⁄ 2012-8-20 œ¬ŒÁ10:47£¨ <ncl-talk-request@ucar.edu>–¥µ¿£∫
> Send ncl-talk mailing list submissions to
> ncl-talk@ucar.edu
>
> To subscribe or unsubscribe via the World Wide Web, visit
> http://mailman.ucar.edu/mailman/listinfo/ncl-talk
> or, via email, send a message with subject or body 'help' to
> ncl-talk-request@ucar.edu
>
> You can reach the person managing the list at
> ncl-talk-owner@ucar.edu
>
> When replying, please edit your Subject line so it is more specific
> than "Re: Contents of ncl-talk digest..."
>
>
> Today's Topics:
>
> 1. Bandpass Filter (abheera hazra)
> 2. Re: Bandpass Filter (Dennis Shea)
> 3. Re: Why I can not get the correct marker sizes? (Mary Haley)
> 4. Re: FW: I mean regridding the data to a rectiliniear lat /
> lon grid (Mary Haley)
> 5. The compile and link failed (srinivasu)
> 6. Re: The compile and link failed (Dennis Shea)
> 7. Re: linint2_Wrap Regriding (Mary Haley)
>
>
> ----------------------------------------------------------------------
>
> Message: 1
> Date: Sun, 19 Aug 2012 22:32:01 -0600
> From: abheera hazra <hazra.abheera@gmail.com>
> Subject: Bandpass Filter
> To: ncl-talk@ucar.edu
> Message-ID:
> <
> CAO5mU5vAbuvzJrx4q4UxLoHugt9kmRw9QHN5mGTRgMjzWT_y3w@mail.gmail.com>
> Content-Type: text/plain; charset="iso-8859-1"
>
> Hi,
>
> I am new to coding in NCL, I am trying to run a time series through the
> bandpass filter ( band_pass_latlon_time), my data has missing values, I'd
> like to know how the above bandpass function would know this missing value?
> Should it be declared in any way before the function call or are there
> values that NCL considers 'missing value' by default?
>
> Thanks,
> Abheera
> -------------- next part --------------
> An HTML attachment was scrubbed...
> URL:
> http://mailman.ucar.edu/pipermail/ncl-talk/attachments/20120819/f25fbbbc/attachment.html
>
> ------------------------------
>
> Message: 2
> Date: Mon, 20 Aug 2012 06:34:13 -0600
> From: Dennis Shea <shea@ucar.edu>
> Subject: Re: Bandpass Filter
> To: abheera hazra <hazra.abheera@gmail.com>
> Cc: ncl-talk@ucar.edu
> Message-ID: <50322EC5.6070609@ucar.edu>
> Content-Type: text/plain; charset=ISO-8859-1; format=flowed
>
> The attribute _FillValue is a special reserved attribute name that
> denotes what values stored in a variable should be considered missing
> values. This must be the same type as the variable. It should be
> set to some value outside the normal variable range.
>
> ---
>
> If you are new to NCL, please read the mini-Language manual at:
> http://www.ncl.ucar.edu/Document/Manuals/
>
> Also, the reference manual:
> http://www.ncl.ucar.edu/Document/Manuals/Ref_Manual/
> There is a whole section on this:
>
>
> Variables
>
> Properties of Variables
> Attributes
> Missing values <==========
> Dimensions
> Coordinates
> String references (Using '$' to reference Atts., Coords., and
> Dimensions)
> Variables used as parameters to functions and procedures
>
> ----
>
>
>
> On 8/19/12 10:32 PM, abheera hazra wrote:
> > Hi,
> >
> > I am new to coding in NCL, I am trying to run a time series through the
> > bandpass filter ( band_pass_latlon_time), my data has missing values,
> > I'd like to know how the above bandpass function would know this missing
> > value? Should it be declared in any way before the function call or are
> > there values that NCL considers 'missing value' by default?
> >
> > Thanks,
> > Abheera
> >
> >
> > _______________________________________________
> > ncl-talk mailing list
> > List instructions, subscriber options, unsubscribe:
> > http://mailman.ucar.edu/mailman/listinfo/ncl-talk
> >
>
>
> ------------------------------
>
> Message: 3
> Date: Mon, 20 Aug 2012 08:02:57 -0600
> From: Mary Haley <haley@ucar.edu>
> Subject: Re: Why I can not get the correct marker sizes?
> To: xiang lin <leo.aries.g@gmail.com>
> Cc: ncl-talk@ucar.edu
> Message-ID: <A33F1117-60B2-4986-9ACB-5AB53BCD6EFA@ucar.edu>
> Content-Type: text/plain; charset="us-ascii"
>
> I think you need to use larger marker sizes. Try making them a factor of 5
> or 10 larger.
>
> --Mary
>
> On Aug 19, 2012, at 1:15 AM, xiang lin wrote:
>
> > Hi, all
> >
> >
> > I made a classified post map using NCL, Here below is my scripts
> ( derived from the example in the
> http://ncl.ucar.edu/Applications/Scripts/polyg_8.ncl).
> >
> > I can not get the correct gsmarker sizes as described in the scripts (as
> seen in the attached ps file). Anyone can give me some instruction? Thank!
> >
> >
> > ; *****************************************************
> > load "$NCARG_ROOT/lib/ncarg/nclscripts/csm/gsn_code.ncl"
> > load "$NCARG_ROOT/lib/ncarg/nclscripts/csm/gsn_csm.ncl"
> > load "$NCARG_ROOT/lib/ncarg/nclscripts/csm/contributed.ncl"
> >
> > begin
> >
> > data_path = "/data1/Antarctic_Data/Antarctic_station.temp_1979-2011/"
> >
> > sta_name =
> (/"Amundsen_Scott","Bellingshausen","Casey","Davis","Dumont_Durville","Faraday_Vernadsky","Halley","Mawson","Mirny","Neumayer_1982-2011","Novolazarevskaya",\
> > "Orcadas","Rothera","Scott_Base","Syowa"/)
> >
> >
> >
> > ; ****************** read the AAO index series
> ********************************************
> > data =
> asciiread("/data1/Antarctic_Data/AAO_monthly_197901-201112.txt",(/33*12,3/),"float")
> > vars = (/"DJF","MAM","JJA","SON","ANN"/)
> > xx = data(:,2)
> > xx!0 = "time"
> > xx&time= fspan(1979.08,2012.,33*12)
> >
> > y = new((/5,33/),"float")
> > y(4,:) = month_to_annual(xx,1)
> > y(0,:) = month_to_season(xx,"DJF")
> > y(1,:) = month_to_season(xx,"MAM")
> > y(2,:) = month_to_season(xx,"JJA")
> > y(3,:) = month_to_season(xx,"SON")
> > printVarSummary(y)
> > y!0 = "nvars"
> > delete(data)
> >
> >
> > ; calculate the correlation
> > ccr = new((/14,5/),"float")
> > do i = 0,13
> >
> > data_filename = data_path + sta_name(i) + ".txt"
> > print(" " + data_filename)
> >
> > data = asciiread(data_filename, (/33,14/),"float")
> > x = data(:,1:12)
> > xy = ndtooned(x)
> > xy!0 = "time"
> > z = new((/5,33/),"float")
> > z(4,:) = data(:,13)
> > z(0,:) = month_to_season(xy,"DJF")
> > z(1,:) = month_to_season(xy,"MAM")
> > z(2,:) = month_to_season(xy,"JJA")
> > z(3,:) = month_to_season(xy,"SON")
> >
> > ccr(i,:) = escorc(y,z)
> >
> > end do
> >
> > opt = True
> > opt@fout = "Corr_AAO.vs.stationTemp.dat"
> > ftmx = "5f8.3"
> > write_matrix(ccr, ftmx, opt)
> >
> > ; plot ********************************
> >
> > ; -------Options--------
> >
> > arr = (/-0.45,-0.35,0.,0.35,0.45/) ; bin settings (bin0 = < 0.,
> > ; bin1 = 0.:4.999, etc.)
> > colors = (/"blue","blue","blue","red","red","red"/) ; marker colors,
> dimsizes must
> > ; be equal to dimsizes(arr)+1
> > sizes = (/3,2,1,1,2,3/)*0.006
> > labels = new(dimsizes(arr)+1,string) ; Labels for legend.
> >
> > npts = 14
> > lat = asciiread("14stations_lat.txt",-1,"float")
> > lon = asciiread("14stations_lon.txt",-1,"float")
> > data1 = asciiread("Corr_AAO.vs.stationTemp.dat",(/14,5/),"float")
> > R = data1(:,1)
> > season = "MAM"
> >
> > ; ------------------------------
> > ; Create X and Y arrays to hold the points for each range and initialize
> > ; them to missing values. We want to use num_distinct_markers
> > ; different colors, so we need num_distinct_markers sets of X and
> > ; Y points.
> > ;
> > num_distinct_markers = dimsizes(arr)+1 ; number of distinct
> markers
> > lat_new = new((/num_distinct_markers,dimsizes(R)/),float,-999)
> > lon_new = new((/num_distinct_markers,dimsizes(R)/),float,-999)
> > ;
> > ; Group the points according to which range they fall in. At the
> > ; same time, create the label that we will use later in the legend.
> > ;
> > do i = 0, num_distinct_markers-1
> > if (i.eq.0) then
> > indexes = ind(R.lt.arr(0))
> > labels(i) = "x < " + arr(0)
> > end if
> > if (i.eq.num_distinct_markers-1) then
> > indexes = ind(R.ge.max(arr))
> > labels(i) = "x >= " + max(arr)
> > end if
> > if (i.gt.0.and.i.lt.num_distinct_markers-1) then
> > indexes = ind(R.ge.arr(i-1).and.R.lt.arr(i))
> > labels(i) = arr(i-1) + " <= x < " + arr(i)
> > end if
> > ;
> > ; Now that we have the set of indexes whose values fall within
> > ; the given range, take the corresponding lat/lon values and store
> > ; them, so later we can color this set of markers with the appropriate
> > ; color.
> > ;
> > if (.not.any(ismissing(indexes))) then
> > npts_range = dimsizes(indexes) ; # of points in this range.
> > lat_new(i,0:npts_range-1) = lat(indexes)
> > lon_new(i,0:npts_range-1) = lon(indexes)
> > end if
> > delete(indexes) ; Necessary b/c "indexes" may be a
> different
> > ; size next time.
> > end do
> >
> >
> ;===========================================================================
> > ; Begin plotting section.
> > ;
> > wks = gsn_open_wks("eps","Corr_AAO.vs.Antarctic.StationTemp_" + season
> ) ; Open a workstation and
> > gsn_define_colormap(wks,"WhViBlGrYeOrRe") ; define a different
> colormap.
> >
> > nc1 = NhlNewColor(wks,.8,.8,.8) ; Add light gray to colormap,
> > ; for continents.
> > ;
> > ; Set up some map resources
> > ;
> > mpres = True
> > mpres@gsnMaximize = True ; Maximize plot in frame.
> > mpres@gsnFrame = False ; Don't advance the frame
> > ;
> > ; Zoom in on United States.
> > ;
> > ; mpres@mpMinLatF = 25.
> > ; mpres@mpMaxLatF = 50.
> > ; mpres@mpMinLonF = 235.
> > ; mpres@mpMaxLonF = 290.
> >
> > mpres@gsnPolar = "SH"
> > mpres@mpMaxLatF = -50
> >
> > ; mpres@mpFillColors = (/-1,-1,nc1,-1/) ;assign light gray to land
> masses
> >
> > ; mpres@tiMainString = "Dummy station data colored and~C~sized
> according to range of values"
> > mpres@tiMainString = "Correlation: AAO vs Temperature (" + season +
> ")"
> > map = gsn_csm_map(wks,mpres)
> >
> >
> > ; Create logical variables to hold the marker and text resources.
> > ; These markers are different than the XY markers, because they are not
> > ; associated with an XY plot. You can put these markers on any plot.
> > ;
> > gsres = True
> > gsres@gsMarkerIndex = 16 ; Use filled dots for markers.
> >
> > txres = True
> > txres@txFontHeightF = 0.015
> >
> > ;
> > ; Loop through each grouping of markers, and draw them one set at
> > ; a time, assigning the proper color and size with gsn_marker.
> > ;
> > ; At the same time, draw a legend showing the meaning of the markers.
> > ;
> >
> > xleg = (/0.07,0.07,0.32,0.32,0.57,0.57,0.82,0.82/) ; Location of
> > xtxt = (/0.16,0.16,0.44,0.44,0.66,0.66,0.91,0.91/) ; legend markers
> > yleg = (/0.22,0.17,0.22,0.17,0.22,0.17,0.22,0.17/) - 0.03 ; and text
> > ytxt = (/0.22,0.17,0.22,0.17,0.22,0.17,0.22,0.17/) - 0.03 ; strings.
> >
> > do i = 0, num_distinct_markers-1
> > print(" " + lat_new(i,0))
> > if (.not.ismissing(lat_new(i,0)))
> > gsres@gsMarkerColor = colors(i)
> > gsres@gsMarkerSizeF = sizes(i)
> > gsn_polymarker(wks,map,lon_new(i,:),lat_new(i,:),gsres)
> > end if
> > ; Add marker and text for the legend.
> > ;
> > gsn_polymarker_ndc(wks, xleg(i),yleg(i),gsres)
> > gsn_text_ndc (wks,labels(i),xtxt(i),ytxt(i),txres)
> > ; end if
> > end do
> >
> > frame(wks) ; Advance the frame.
> >
> >
> > end
> >
> >
> >
> > Leo
> >
> >
> >
> <Corr_AAO.vs.Antarctic.StationTemp_MAM.eps>_______________________________________________
> > ncl-talk mailing list
> > List instructions, subscriber options, unsubscribe:
> > http://mailman.ucar.edu/mailman/listinfo/ncl-talk
>
> -------------- next part --------------
> An HTML attachment was scrubbed...
> URL:
> http://mailman.ucar.edu/pipermail/ncl-talk/attachments/20120820/47bfdf38/attachment.html
>
> ------------------------------
>
> Message: 4
> Date: Mon, 20 Aug 2012 08:06:51 -0600
> From: Mary Haley <haley@ucar.edu>
> Subject: Re: FW: I mean regridding the data to a
> rectiliniear lat / lon grid
> To: Gualberto Hern?ndez Ju?rez <betoic@hotmail.com>
> Cc: ncl-talk@ucar.edu, kgriffin@albany.edu
> Message-ID: <A62EA410-C22D-4DE8-805E-FBC603608700@ucar.edu>
> Content-Type: text/plain; charset="utf-8"
>
>
> On Aug 17, 2012, at 11:24 AM, Gualberto Hern?ndez Ju?rez wrote:
>
> > I find the following error, someone knows why?
> >
> > toshiba@ubuntu:~/MM5V3/ncl_ncarg-6.1.0-beta$ ncl_filedump
> MMOUT_DOMAINE.grb
> >
> > ncl: error while loading shared libraries: libssl.so.0.9.8: cannot open
> shared object file: No such file or directory
>
> You either need to install SSL, or set an environment variable to point to
> the location of SSL. For more information, see:
>
> http://www.ncl.ucar.edu/Download/linux.shtml#SharedLibraries
>
> --Mary
>
>
>
> > Thanks
> > Gualberto
> >
> >
> > From: kgriffin@albany.edu
> > Date: Fri, 17 Aug 2012 12:06:50 -0500
> > Subject: Re: FW: I mean regridding the data to a rectiliniear
> lat / lon grid
> > To: betoic@hotmail.com
> > CC: ncl-talk@ucar.edu
> >
> > Try using the ncl_filedump command, it can list variable names of any
> file NCL can read, including GRIB1/2 files.
> >
> > See http://www.ncl.ucar.edu/Document/Tools/ncl_filedump.shtml for
> information on its use.
> >
> >
> > Kyle
> > -----------------------------------------------------
> > Kyle S. Griffin
> > Dept. of Atmospheric and Environmental Sciences
> > University at Albany, SUNY
> > 1400 Washington Ave, Albany, NY 12222
> > Office: ES-218 Email: kgriffin@albany.edu
> > http://www.atmos.albany.edu/student/kgriffin/
> >
> >
> >
> > On Fri, Aug 17, 2012 at 12:03 PM, Gualberto Hern?ndez Ju?rez <
> betoic@hotmail.com> wrote:
> > Hi all,
> >
> > NCL I have a tool that allows me to see the name of the variables that
> contains the following file GRIB1?
> >
> > https://dl.dropbox.com/u/96409134/MMOUT_DOMAIN1B.grb
> >
> > Can anyone tell me the name of the variables?
> >
> > Thank you very much,
> > Gualberto
> >
> >
> >
> >
> >
> >
> >
> >
> >
> >
> > Subject: Re: FW: I mean regridding the data to a rectiliniear
> lat / lon grid
> > From: dbrown@ucar.edu
> > Date: Fri, 10 Aug 2012 14:00:24 -0600
> > CC: ncl-talk@ucar.edu
> > To: betoic@hotmail.com
> >
> > Hi Gualberto,
> > I am enclosing a modified version of the script that uses NCL to
> generate the 2D lat/lon coordinate arrays and write them to a file. To
> demonstrate their correctness, it uses them to
> > transform the data into an orthographic projection. You can use the
> lat/lon arrays to perform the re-gridding, step 4 of the process outlined
> by Dave Allured. For that I recommend studying the
> > ESMF regridding examples at
> http://www.ncl.ucar.edu/Applications/ESMF.shtml. You will need NCL
> 6.1.0-beta if you don't have it already. I also am attaching the
> orthographic plot.
> > -dave
> >
> >
> >
> >
> > On Aug 9, 2012, at 11:41 PM, Gualberto Hern?ndez Ju?rez wrote:
> >
> > Dave,
> >
> > I offer you excuse for late reply,
> >
> > So I understand with the file you sent me "lcnative.ncl" I can now run
> the regridding?
> >
> > You will have some very basic example that can serve as reference to do
> it? I suppose I have to use ESMF.
> >
> > Thanks,
> > Gualberto
> >
> > Subject: Re: FW: I mean regridding the data to a rectiliniear
> lat / lon grid
> > From: dbrown@ucar.edu
> > Date: Thu, 9 Aug 2012 17:02:01 -0600
> > CC: ncl-talk@ucar.edu
> > To: betoic@hotmail.com
> >
> > Hi Gualberto,
> > I have figured out what I think are the correct (or at least close
> enough) parameters to get the right results from the PROJ4 tool. I think
> the main issue I was having is that the Lambert Conformal Conic projection
> has a singularity over the equator, because it ceases to be conic and
> becomes a cylinder. At least NCL does not work with a single parallel set
> to 0.0. However, I can make it work using 2 standard parallels very close
> to each other (0.0 and 0.01). The PROJ4 tool does not give up, but the
> numbers were wrong if you do not do something similar. Anyway it would now
> be possible to generate the 2d lat/lon arrays that you will need for
> re-gridding, either just using PROJ4 or by sampling the projected space in
> NCL. I am attaching a plot of temperature that I think shows the map
> boundaries aligning very well with the data. I also include the version of
> the script that created it.
> > -dave
> >
> >
> >
> > On Aug 8, 2012, at 1:47 PM, Gualberto Hern?ndez Ju?rez wrote:
> >
> > I have not done, mainly because ArcGis also limited in NetCDF format
> >
> > From: dbrown@ucar.edu
> > Subject: Re: FW: I mean regridding the data to a rectiliniear
> lat / lon grid
> > Date: Wed, 8 Aug 2012 12:46:30 -0600
> > To: betoic@hotmail.com
> >
> > One question: Can you find out the projection parameters and/or the
> corner lat/lon values using ArcGIS?
> > -dave
> >
> > On Aug 8, 2012, at 12:35 PM, Gualberto Hern?ndez Ju?rez wrote:
> >
> >
> > Dave,
> >
> > This is how I see it in ArcGIS, corresponds to the same variable MSLP.
> As you said the picture you sent me is a little shaky.
> >
> > Gualberto.
> >
> >
> > From: dbrown@ucar.edu
> > Subject: Re: FW: I mean regridding the data to a rectiliniear
> lat / lon grid
> > Date: Wed, 8 Aug 2012 11:17:02 -0600
> > To: betoic@hotmail.com
> >
> > I was hoping for an image with the continental boundaries correctly
> placed. To show you what I mean here is the best I have been able to do
> using NCL. The trick is to figure out the correct projection parameters and
> the lat/lon locations of the lower left and upper right corner points. I
> did this using the PROJ4 projection tool (similar in capabilities to the
> tool Dave Allured recommended -- MPS Geotrans). But I am not sure I got the
> right values because it looks to me like the data does not quite fit the
> map outlines. I would not trust any re-gridding operation if I could not
> first get the the map outlines correctly placed. It looks to me (based on
> plotting a number of the pressure and temperature time steps) that the
> lower part of Mexico and Central America is skewed to the right and that
> not so much of South America should be visible. Anyway so you know what I
> am talking about I am attaching the plot I came up with in NCL. Also the
> script as it exists now. Perhaps you h
> ave access to more information about the projection parameters?
> > -dave
> >
> >
> >
> >
> > On Aug 7, 2012, at 8:20 PM, Gualberto Hern?ndez Ju?rez wrote:
> >
> >
> >
> > Dave,
> >
> > I send the image
> >
> > From: dbrown@ucar.edu
> > Subject: Re: FW: I mean regridding the data to a rectiliniear
> lat / lon grid
> > Date: Tue, 7 Aug 2012 18:16:24 -0600
> > To: betoic@hotmail.com
> >
> > Sorry maybe I misunderstand. I have the NetCDF file MMOUT_DOMAIN1.nc.
> But I thought you said you uploaded an image (picture ??) of the plot you
> made in ArcMap. I would like to see the picture if you can send it.
> > -dave
> >
> > On Aug 7, 2012, at 5:23 PM, Gualberto Hern?ndez Ju?rez wrote:
> >
> > This is the file MMOUT_DOMAIN1.nc
> >
> > The file you put in place it ftp://ftp.cgd.ucar.edu/incoming/
> >
> >
> > From: dbrown@ucar.edu
> > Subject: Re: FW: I mean regridding the data to a rectiliniear
> lat / lon grid
> > Date: Tue, 7 Aug 2012 17:19:16 -0600
> > To: betoic@hotmail.com
> >
> > (offline)
> > I need to know what you called the file in order to retrieve it.
> > -dave
> >
> > On Aug 7, 2012, at 5:10 PM, Gualberto Hern?ndez Ju?rez wrote:
> >
> > Thanks for your reply Dave,
> >
> > I plot the file only in ArcMap of ArcGIS, place an image in the
> directory:
> >
> >
> > ftp://ftp.cgd.ucar.edu/incoming/
> >
> >
> > I just have to put the map of the Mexican republic.
> >
> >
> > Subject: Re: FW: I mean regridding the data to a rectiliniear
> lat / lon grid
> > From: dbrown@ucar.edu
> > Date: Tue, 7 Aug 2012 16:41:41 -0600
> > CC: ncl-talk@ucar.edu
> > To: betoic@hotmail.com
> >
> > Hi Gaulberto,
> > Here is a way to write the text file as X/Y pairs as Dave Allured
> suggested:
> >
> > f = addfile ("MMOUT_DOMAIN1.nc", "r")
> > x = f->lon
> > y = f->lat
> > nx = dimsizes(x)
> > ny = dimsizes(y)
> > x2d = conform_dims((/ny,nx/),x,1)
> > y2d = conform_dims((/ny,nx/),y,0)
> > outstr = sprintf("%9.3f",x2d) + " " + sprintf("%9.3f",y2d)
> > asciiwrite("xy.txt",outstr)
> >
> > I wonder if you have a plot of this grid in its native (Lambert
> Conformal) configuration. I have tried to plot it based on the LC
> parameters given in the data file, but so far I have been unsuccessful.
> > A correct plot of the domain would help.
> >
> > If you can get NCL to plot the data correctly in its native projection,
> then it is possible to compute the lat/lon coordinates using NCL by itself.
> > -dave
> >
> >
> > On Aug 7, 2012, at 2:06 PM, Gualberto Hern?ndez Ju?rez wrote:
> >
> > Dave,
> > How to make the text file, which you mention in the first point.
> >
> > Thanks
> > Gualberto
> >
> > > Date: Tue, 7 Aug 2012 11:44:09 -0600
> > > Subject: Re: I mean regridding the data to a rectiliniear
> lat / lon grid
> > > From: dave.allured@noaa.gov
> > > To: betoic@hotmail.com
> > > CC: ncl-talk@ucar.edu
> > >
> > > Here is one way. I am sure there are others.
> > >
> > > 1. Use NCL to make a text file containing a 1-dimensional ordered
> > > list of all X/Y coordinate pairs.
> > >
> > > 2. Use MPS Geotrans in batch mode to translate the list of
> > > coordinates from Lambert Conformal to terrestrial lat/lon. It's free
> > > software, and it supports a huge variety of known terrestrial
> > > coordinate systems.
> > >
> > > http://earth-info.nga.mil/GandG/geotrans/
> > >
> > > 3. Use NCL to read in the translated coordinates, and reshape them
> > > into 2-D lat and lon coordinate arrays.
> > >
> > > 4. Use one of the many NCL regridding functions, plus the 2-D
> > > coordinates from step 3, to regrid the data array to a rectilinear
> > > grid of your choice.
> > >
> > > This is an overview. Steps 1 and 3 are fairly straightforward NCL
> > > coding. Steps 2 and 4 will involve significant study to get them
> > > working correctly. HTH.
> > >
> > > --Dave
> > >
> > > On Tue, Aug 7, 2012 at 10:54 AM, Gualberto Hern?ndez Ju?rez
> > > <betoic@hotmail.com> wrote:
> > > > I need *regrid* the 2D lat/lon to a rectilinear lat lon.
> > > >
> > > > any comments will be grateful enough support, I'm new to NCL.
> > > >
> > > > Thank you,
> > > > Gualberto
> > > >
> > > >
> > > >> Date: Tue, 7 Aug 2012 10:41:42 -0600
> > > >> From: shea@ucar.edu
> > > >> To: betoic@hotmail.com
> > > >> CC: ncl-talk@ucar.edu
> > > >> Subject: Re: I mean regridding the data to a
> rectiliniear lat /
> > > >> lon grid
> > > >>
> > > >> Technically, this is already a rectilinear grid.
> > > >>
> > > >> double lat ( lat )
> > > >> _CoordinateAxisType : GeoY
> > > >> axis : Y
> > > >> grid_spacing : 27.0 km
> > > >> long_name : y coordinate of projection
> > > >> standard_name : projection_y_coordinate
> > > >> units : km
> > > >>
> > > >> double lon ( lon )
> > > >> _CoordinateAxisType : GeoX
> > > >> axis : X
> > > >> grid_spacing : 27.0 km
> > > >> long_name : x coordinate of projection
> > > >> standard_name : projection_x_coordinate
> > > >> units : km
> > > >>
> > > >> float u10 ( time, lat, lon )
> > > >> long_name : 10 m u wind (m/sec)
> > > >> _FillValue : -9999
> > > >> grid_mapping : Lambert_Conformal
> > > >>
> > > >> The issue is that the poorly named 'lat' and 'lon' variables
> > > >> should be (say) 'y' and 'x'.
> > > >>
> > > >> Basically, the projection information
> > > >>
> > > >> character Lambert_Conformal ( ncl_scalar )
> > > >> grid_mapping_name : lambert_conformal_conic
> > > >> long_name :
> > > >> latitude_of_projection_origin : 0
> > > >> longitude_of_central_meridian : -124.17
> > > >> false_easting : 0
> > > >> false_northing : -27
> > > >> standard_parallel : 0
> > > >> _CoordinateTransformType : Projection
> > > >> _CoordinateAxisTypes : GeoX GeoY
> > > >> earth_shape : Earth spherical with radius of 6,371,229.0 m
> > > >> earth_radius : 6371229
> > > >>
> > > >> must be used to generate two-dimensional latitude and longitude
> > > >> coordinates for each grid point. Then the data can be plotted on the
> > > >> lambert map projection. Is this what you want?
> > > >>
> > > >> *** I have no idea how to do this. Maybe someone else does. ***
> > > >>
> > > >> Then, if you really want to *regrid* the 2D lat/lon to a rectilinear
> > > >> lat lon, you would have to use the ESMF regridding
> > > >> http://www.ncl.ucar.edu/Applications/ESMF.shtml
> > > >>
> > > >>
> > > >> On 8/7/12 10:12 AM, Gualberto Hern?ndez Ju?rez wrote:
> > > >> > Hi,
> > > >> >
> > > >> > I mean regridding the data to a rectiliniear lat / lon grid
> > > >> >
> > > >> > locate the file in the directory:
> > > >> >
> > > >> > ftp://ftp.cgd.ucar.edu/incoming/
> > > >> >
> > > >> > or you can download from this link:
> > > >> >
> > > >> > https://dl.dropbox.com/u/96409134/MMOUT_DOMAIN1.nc
> > > >> >
> > > >> > Thanks I'll be awaiting your response.
> > > >> > Gualberto
> > _______________________________________________
> > ncl-talk mailing list
> > List instructions, subscriber options, unsubscribe:
> > http://mailman.ucar.edu/mailman/listinfo/ncl-talk
> >
> > _______________________________________________
> > ncl-talk mailing list
> > List instructions, subscriber options, unsubscribe:
> > http://mailman.ucar.edu/mailman/listinfo/ncl-talk
> >
> >
> >
> > <Huracan Bud.jpg>_______________________________________________
> > ncl-talk mailing list
> > List instructions, subscriber options, unsubscribe:
> > http://mailman.ucar.edu/mailman/listinfo/ncl-talk
> >
> >
> <PresionSNivelMar23-05-2012_4-00pm.jpg>_______________________________________________
> > ncl-talk mailing list
> > List instructions, subscriber options, unsubscribe:
> > http://mailman.ucar.edu/mailman/listinfo/ncl-talk
> >
> > _______________________________________________
> > ncl-talk mailing list
> > List instructions, subscriber options, unsubscribe:
> > http://mailman.ucar.edu/mailman/listinfo/ncl-talk
> >
> >
> >
> >
> > _______________________________________________
> > ncl-talk mailing list
> > List instructions, subscriber options, unsubscribe:
> > http://mailman.ucar.edu/mailman/listinfo/ncl-talk
> >
> >
> > _______________________________________________
> > ncl-talk mailing list
> > List instructions, subscriber options, unsubscribe:
> > http://mailman.ucar.edu/mailman/listinfo/ncl-talk
>
> -------------- next part --------------
> An HTML attachment was scrubbed...
> URL:
> http://mailman.ucar.edu/pipermail/ncl-talk/attachments/20120820/173ac085/attachment.html
>
> ------------------------------
>
> Message: 5
> Date: Mon, 20 Aug 2012 20:05:59 +0530
> From: srinivasu <vasu123geo@gmail.com>
> Subject: The compile and link failed
> To: ncl-talk@ucar.edu
> Message-ID:
> <CAAeZhUa=
> KNPTqNKZcWpAY+BPa6h9C4CqzQyF2MZdKvDym4Wypg@mail.gmail.com>
> Content-Type: text/plain; charset="iso-8859-1"
>
> Hi all,
> I am trying build NCl with OpenDap not enabled.After going through the
> process,I tried
>
> ng4ex gsun01n
>
> It worked.It showed some graphics.When I tried
>
> ncargex cpex08 -clean
>
> It threw the error
>
> Compiling and linking...
> gfortran -fPIC -fno-second-underscore -fno-range-check -O -o cpex08
> cpexcc.f cpex08.f -L/usr/local/lib -lncarg -lncarg_gks -lncarg_c -lX11
> -lXext -lcairo -lXrender -lfontconfig -lpixman-1 -lfreetype -lexpat
> -lpng -lz -lbz2 -lpthread
> /usr/bin/ld: cannot find -lcairo
> /usr/bin/ld: cannot find -lpng
> /usr/bin/ld: cannot find -lbz2
> collect2: ld returned 1 exit status
>
> The compile and link failed.
>
> Can some one help me regarding this.
>
> Thanks in advance..
>
> Srinivas
> -------------- next part --------------
> An HTML attachment was scrubbed...
> URL:
> http://mailman.ucar.edu/pipermail/ncl-talk/attachments/20120820/70003926/attachment.html
>
> ------------------------------
>
> Message: 6
> Date: Mon, 20 Aug 2012 08:39:25 -0600
> From: Dennis Shea <shea@ucar.edu>
> Subject: Re: The compile and link failed
> To: srinivasu <vasu123geo@gmail.com>
> Cc: ncl-talk@ucar.edu, NCL <ncl-install@ucar.edu>
> Message-ID: <50324C1D.5060706@ucar.edu>
> Content-Type: text/plain; charset=ISO-8859-1; format=flowed
>
> Please send *all* NCL installation questions to the appropriate
> email list. ncl-install@ucar.edu [cc'd here]
>
>
> On 8/20/12 8:35 AM, srinivasu wrote:
> > Hi all,
> > I am trying build NCl with OpenDap not enabled.After going through the
> > process,I tried
> >
> > ng4ex gsun01n
> >
> > It worked.It showed some graphics.When I tried
> >
> > ncargex cpex08 -clean
> >
> > It threw the error
> >
> >
> > Compiling and linking...
> > gfortran -fPIC -fno-second-underscore -fno-range-check -O -o cpex08
> cpexcc.f cpex08.f -L/usr/local/lib -lncarg -lncarg_gks -lncarg_c -lX11
> -lXext -lcairo -lXrender -lfontconfig -lpixman-1 -lfreetype -lexpat -lpng
> -lz -lbz2 -lpthread
> > /usr/bin/ld: cannot find -lcairo
> > /usr/bin/ld: cannot find -lpng
> > /usr/bin/ld: cannot find -lbz2
> > collect2: ld returned 1 exit status
> >
> > The compile and link failed.
> >
> > Can some one help me regarding this.
> >
> > Thanks in advance..
> >
> > Srinivas
> >
> >
> >
> >
> >
> >
> > _______________________________________________
> > ncl-talk mailing list
> > List instructions, subscriber options, unsubscribe:
> > http://mailman.ucar.edu/mailman/listinfo/ncl-talk
> >
>
>
> ------------------------------
>
> Message: 7
> Date: Mon, 20 Aug 2012 08:46:35 -0600
> From: Mary Haley <haley@ucar.edu>
> Subject: Re: linint2_Wrap Regriding
> To: Ping Yang <pyang@ccny.cuny.edu>
> Cc: NCL Talk <ncl-talk@ucar.edu>
> Message-ID: <6D3C7145-0760-4D9C-BFE0-EFC57497701A@ucar.edu>
> Content-Type: text/plain; charset="us-ascii"
>
> Ping,
>
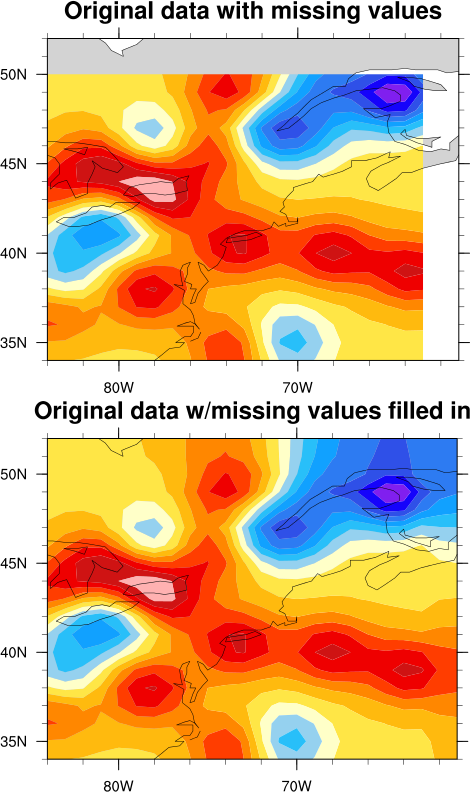
> Maybe poisson_grid_fill is what you want. See the attached example and
> PNG. The key is that you need to create a new
> data array that extends out to the lat/lon area that you want extrapolated
> to, and then use poisson_grill_fill to fill in the missing values.
>
>
> --Mary
>
> On Aug 17, 2012, at 9:39 AM, Ping Yang wrote:
>
> > Hi NCL,
> >
> > I am asking if there is a function in NCL like the GIS buffering, e.g.,
> I have a data(in the dash box show below), What I want to do is like this:
> > Buffer(or interpolate/regridding) the dashed box data to the solid
> box(where the space between the dashed box and solid box was no data there)
> but keep the original cell value in the dashed box no change.
> >
> > <image.png>
> >
> >
> > Have someone have done similar thing before. I will be appreciated if
> you can give me suggestions and advice.
> >
> > Thanks,
> >
> > Ping
> > On Mon, Aug 13, 2012 at 11:47 PM, Dennis Shea <shea@ucar.edu> wrote:
> > The error message is telling you exactly what the error is.
> >
> > V = cru1990->precipitation ==> V(12,360,720)
> >
> > Your new lat/lon are (306,384)
> >
> >
> > newlon = fspan(-84.025,-64.875,384)
> > newlat = fspan(34.875,50.125,306)
> >
> > Hence,
> >
> > linint2_Wrap(V&longitude,V&latitude,V,True,newlon,newlat,0)
> >
> > would be result in a (12,306,384) array.
> >
> > So, you are trying to place a (12,306,384) array into a (12,360,720).
> > Like the error message says, "Dimension sizes of left hand side and
> >
> > right hand side of assignment do not match."
> >
> > Currently, NCL does not allow this. (It will in a future release.)
> >
> > Change to:
> >
> > Vnew = linint2_Wrap(V&longitude,V&latitude,V,True,newlon,newlat,0)
> > printVarSummary(Vnew)
> >
> >
> >
> >
> > On 8/13/12 9:28 PM, Ping Yang wrote:
> > Hi Adam,
> >
> > I got a problem with the regridding using linint2_Wrap(it was working
> > for the daily data) with a monthly data,
> > the is an error showed:
> > fatal:Dimension sizes of left hand side and right hand side of
> > assignment do not match.
> > I ncdump -c the data file:
> > netcdf Global_Precipitation_CRU21_30min_mT1980 {
> > dimensions:
> > latitude = 360 ;
> > longitude = 720 ;
> > bnds = 2 ;
> > time = UNLIMITED ; // (12 currently)
> > variables:
> > double latitude(latitude) ;
> > latitude:long_name = "Latitude" ;
> > latitude:standard_name = "latitude_north" ;
> > latitude:units = "degrees_north" ;
> > latitude:valid_range = -90., 90. ;
> > latitude:actual_range = -90., 90. ;
> > latitude:bounds = "longitude_bnds" ;
> > latitude:axis = "y" ;
> > double longitude(longitude) ;
> > longitude:long_name = "Longitude" ;
> > longitude:standard_name = "longitude_east" ;
> > longitude:units = "degrees_east" ;
> > longitude:valid_range = -180., 180. ;
> > longitude:actual_range = -180., 180. ;
> > longitude:axis = "x" ;
> > double latitude_bnds(latitude, bnds) ;
> > double longitude_bnds(longitude, bnds) ;
> > int time(time) ;
> > time:long_name = "Time" ;
> > time:standard_name = "time" ;
> > time:units = "months since 1980-01-01 00:00" ;
> > time:axis = "t" ;
> > time:actual_range = 0, 11 ;
> > double minimum(time) ;
> > double maximum(time) ;
> > double average(time) ;
> > double stddev(time) ;
> > float precipitation(time, latitude, longitude) ;
> > precipitation:long_name = "Glo_CRU21_Precipitation_mTS1980_30min" ;
> > precipitation:standard_name = "Precipitation" ;
> > precipitation:var_desc = "Precipitation" ;
> > precipitation:missing_value = -999.f ;
> > precipitation:_FillValue = -999.f ;
> > precipitation:scale_factor = 1.f ;
> > precipitation:add_offset = 0.f ;
> > precipitation:actual_range = 0.f, 1832.9f ;
> >
> > // global attributes:
> > :Conventions = "CF-1.2" ;
> > :title = "Glo_CRU21_Precipitation_mTS1980_30min" ;
> > :data_type = "continuous" ;
> > :domain = "Global" ;
> > :subject = "precipitation" ;
> > :references = ;
> > :institution = ;
> > :source = ;
> > :comments = ;
> > data:
> >
> > latitude = -89.75, -89.25, -88.75, -88.25, -87.75, -87.25, -86.75,
> > -86.25,
> > -85.75, -85.25, -84.75, -84.25, -83.75, -83.25, -82.75, -82.25,
> > -81.75,
> > -81.25, -80.75, -80.25, -79.75, -79.25, -78.75, -78.25, -77.75,
> > -77.25,
> > ......................
> > 77.25, 77.75, 78.25, 78.75, 79.25, 79.75, 80.25, 80.75, 81.25,
> 81.75,
> > 82.25, 82.75, 83.25, 83.75, 84.25, 84.75, 85.25, 85.75, 86.25,
> 86.75,
> > 87.25, 87.75, 88.25, 88.75, 89.25, 89.75 ;
> >
> > longitude = -179.75, -179.25, -178.75, -178.25, -177.75, -177.25,
> > -176.75,
> > -176.25, -175.75, -175.25, -174.75, -174.25, -173.75, -173.25,
> > -172.75,
> > ..........................
> > 168.75, 169.25, 169.75, 170.25, 170.75, 171.25, 171.75, 172.25,
> > 172.75,
> > 173.25, 173.75, 174.25, 174.75, 175.25, 175.75, 176.25, 176.75,
> > 177.25,
> > 177.75, 178.25, 178.75, 179.25, 179.75 ;
> >
> > time = 0, 1, 2, 3, 4, 5, 6, 7, 8, 9, 10, 11 ;
> > }
> > the longitude and latitude is increasing monotonically
> > and I used the following code to do the regridding:
> >
> > cru1990=addfile(idCRU+"Global_Precipitation_CRU21_30min_mT1980.nc","r");
> >
> > V=cru1990->precipitation(:,:,:)
> >
> > newlon = fspan(-84.025,-64.875,384)
> >
> > newlat = fspan(34.875,50.125,306)
> >
> > ;************************************************
> >
> > ; interpolate to new grid use linint2_Wrap function
> >
> > ;***********************************************
> >
> > V=linint2_Wrap(V&longitude,V&latitude,V,True,newlon,newlat,0)
> >
> >
> > and there was an error:
> >
> > fatal:Dimension sizes of left hand side and right hand side of
> > assignment do not match.
> >
> > Could anyone can help me on this?(Please let me know if there is a place
> > to upload my sample file).
> >
> > Looking forward to hearing from you.
> >
> > Regards,
> >
> > Ping
> > On Thu, May 17, 2012 at 12:45 PM, Adam Phillips <asphilli@ucar.edu
> > <mailto:asphilli@ucar.edu>> wrote:
> >
> > Hi Ping,
> > I think you are on the right track, but you do not need to subset the
> > input array. (I am guessing that you are getting null values around
> the
> > perimeter of your new grid.) When it comes to regridding one needs
> > to make
> > sure that the input latitudes and longitudes and the output
> > latitudes and
> > longitudes are in the same range, and flow in the same direction. You
> > state you want your grid on negative longitudes, which is fine, but
> that
> > means your input longitudes need to span the same range as well. So,
> I
> > would recommend reading in the input data in its' entirety, flipping
> the
> > latitudes, then use lonFlip to convert the longitudes from 0:360 to
> > -180:180:
> >
> > pres=in->pres(:,::-1,:) ; ::-1 = flip latitudes
> > pres = lonFlip(pres)
> > printVarSummary(pres) ; lats should run from S->N, and lons from
> > -180:180
> >
> > newlon = fspan(-84.025,-64.875,383)
> > newlat = fspan(34.875,50.125,305)
> > newlat@units = "degrees_north"
> > newlon@units = "degrees_east"
> > newsst=linint2_Wrap(pres&lon,pres&lat,pres,True,newlon,newlat,0)
> >
> > That should be it. If that doesn't work or if you have further
> questions
> > please respond to ncl-talk.
> > Best regards,
> > Adam
> >
> >
> > > Dear NCL user,
> > >
> > > I am doing interpolation from the PSD data(daily T62 Gaussian grid
> > > (192x94)
> > > 88.542N - 88.542S, 0E - 358.125E) to a 3 minute*3minute lon/lat
> > regular
> > > grid, I have encountered an issue with the bilinear interpolation
> > with the
> > > linint2_Wrap function (Interpolates from a rectilinear grid to
> > another
> > > rectilinear grid using bilinear interpolation, and retains
> > metadata)with
> > > NCL, because I've got invalid values(some of of the value are
> > null). I
> > > used
> > > this code (I used a NCEP/NCAR reanalysis data, which is available
> > by this
> > > link
> > >
> >
> ftp://ftp.cdc.noaa.gov/Datasets/ncep.reanalysis.dailyavgs/surface_gauss/pres.sfc.gauss.2006.nc
> )
> > > :
> > >
> > > ;*************************************************
> > > ; interpolation.ncl
> > > ;
> > > ; Concepts illustrated:
> > > ; - Interpolating from one grid to another using bilinear
> > interpolation
> > > ; use linint2_Wrap function for the retrieving all the metadata
> > > ;create a new file to include the interpolated variable
> > > ;
> > > ;************************************************
> > > load "/usr/local/lib/ncarg/nclscripts/csm/contributed.ncl"
> > > ;load "$NCARG_ROOT/lib/ncarg/nclscripts/csm/contributed.ncl"
> > > ;change $NCARG_ROOT to /usr/local directly.
> > > ;************************************************
> > > begin
> > > ;open file to write variable to(a new netCDF file)
> > > out=addfile("pres.sfc.gauss.2006.interpolated.nc
> > <http://pres.sfc.gauss.2006.interpolated.nc>","c")
> >
> > > ;************************************************
> > > ; read in netCDF file
> > > ;************************************************
> > > in = addfile("pres.sfc.gauss.2006.nc
> > <http://pres.sfc.gauss.2006.nc>","r")
> >
> > > ;************************************************
> > > ; read in pres
> > > ;***********************************************
> > > ;Use a subscript for change the dimension of pressure and also
> > subset the
> > > variable
> > > pres=in->pres(time|:,{lat|34.875:50.125},{lon|95.975:115.125})
> > > ;so the newPres is with the latitude increasing
> > > ;***********************************************************
> > > ;newlon = fspan(-84.025,-64.875,383)
> > > newlon = fspan(95.975,115.125,383);convert to a (0,360) instead of
> > > (-180,+180)
> > > newlat = fspan(34.875,50.125,305)
> > > newlat@units = "degrees_north"
> > > newlon@units = "degrees_east"
> > > ;************************************************
> > > ; interpolate to new grid use linint2_Wrap function
> > > ;***********************************************
> > > newsst=linint2_Wrap(pres&lon,pres&lat,pres,True,newlon,newlat,0)
> > > ;*************output variable to new file****************
> > > out->pres=newsst
> > > end
> > >
> > > Actually I need the domain range is from lon(-84.025,-64.875,383),
> > > lat(34.875,50.125,305) in the lon/lat regular grid, Can I ask you
> > what
> > > will
> > > be the correct range in the Gaussian grid lon 95.975:115.125? I
> tried
> > > several times, it seems that I am confused by the translation,
> > >
> > > Am I use the right function for this interpolation? I will be
> > appreciated
> > > if you can point out where is the problem ?
> > >
> > > Best Regards,
> > >
> > > Ping
> > >
> > > --
> > > Ping Yang, Ph.D.
> > > CUNY Environmental Crossroads Initiative
> > > Marshak Science Building - Suite 925
> > > The City College of New York - CUNY
> > > 160 Convent Avenue, New York NY 10031
> > > Phone: 212-650-5769
> > > Fax: 212-650-7064
> > > _______________________________________________
> > > ncl-talk mailing list
> > > List instructions, subscriber options, unsubscribe:
> > > http://mailman.ucar.edu/mailman/listinfo/ncl-talk
> > >
> >
> >
> > __________________________________________________
> > Adam Phillips asphilli@ucar.edu <mailto:asphilli@ucar.edu>
> >
> > NCAR/Climate and Global Dynamics Division
> > P.O. Box 3000 (303) 497-1726 <tel:%28303%29%20497-1726>
> >
> > Boulder, CO 80307-3000
> > http://www.cgd.ucar.edu/cas/asphilli
> >
> >
> >
> >
> >
> >
> >
> > _______________________________________________
> > ncl-talk mailing list
> > List instructions, subscriber options, unsubscribe:
> > http://mailman.ucar.edu/mailman/listinfo/ncl-talk
> >
> >
> >
> >
> > --
> > Ping Yang, Ph.D.
> > CUNY Environmental Crossroads Initiative
> > Marshak Science Building - Suite 925
> > The City College of New York - CUNY
> > 160 Convent Avenue, New York NY 10031
> > Phone: 212-650-5769
> > Fax: 212-650-7064
> >
> > _______________________________________________
> > ncl-talk mailing list
> > List instructions, subscriber options, unsubscribe:
> > http://mailman.ucar.edu/mailman/listinfo/ncl-talk
>
> -------------- next part --------------
> An HTML attachment was scrubbed...
> URL:
> http://mailman.ucar.edu/pipermail/ncl-talk/attachments/20120820/25b601f5/attachment.html
> -------------- next part --------------
> A non-text attachment was scrubbed...
> Name: exterp.ncl
> Type: application/octet-stream
> Size: 2494 bytes
> Desc: not available
> Url :
> http://mailman.ucar.edu/pipermail/ncl-talk/attachments/20120820/25b601f5/attachment.obj
> -------------- next part --------------
> An HTML attachment was scrubbed...
> URL:
> http://mailman.ucar.edu/pipermail/ncl-talk/attachments/20120820/25b601f5/attachment-0001.html
> -------------- next part --------------
> A non-text attachment was scrubbed...
> Name: exterp.png
> Type: image/png
> Size: 249376 bytes
> Desc: not available
> Url :
> http://mailman.ucar.edu/pipermail/ncl-talk/attachments/20120820/25b601f5/attachment.png
> -------------- next part --------------
> An HTML attachment was scrubbed...
> URL:
> http://mailman.ucar.edu/pipermail/ncl-talk/attachments/20120820/25b601f5/attachment-0002.html
>
> ------------------------------
>
> _______________________________________________
> ncl-talk mailing list
> ncl-talk@ucar.edu
> http://mailman.ucar.edu/mailman/listinfo/ncl-talk
>
>
> End of ncl-talk Digest, Vol 105, Issue 28
> *****************************************
>
_______________________________________________
ncl-talk mailing list
List instructions, subscriber options, unsubscribe:
http://mailman.ucar.edu/mailman/listinfo/ncl-talk
Received on Mon Aug 20 08:55:50 2012
This archive was generated by hypermail 2.1.8 : Tue Aug 28 2012 - 09:22:09 MDT