Hi Dave,
Thank you so much for your time! It also works now at my end.
I will attach a file with large size to your the ftp site next time.
Best regards,
Lifen
2013-02-06
Jiang, Lifen
·˘ĽţČËŁş David Brown
·˘ËÍʱĽäŁş 2013-02-06 16:41:41
ĘŐĽţČËŁş Jiang, Lifen
łËÍŁş ncl-talk
Ö÷Ě⣺ Re: [ncl-talk] Plotting problem
Hi Lifen,
I got your data file. (Note you should not attach such big files to email. We much prefer you to upload them to the ftp site using the directions at the "report bugs" link.)
Nevertheless:
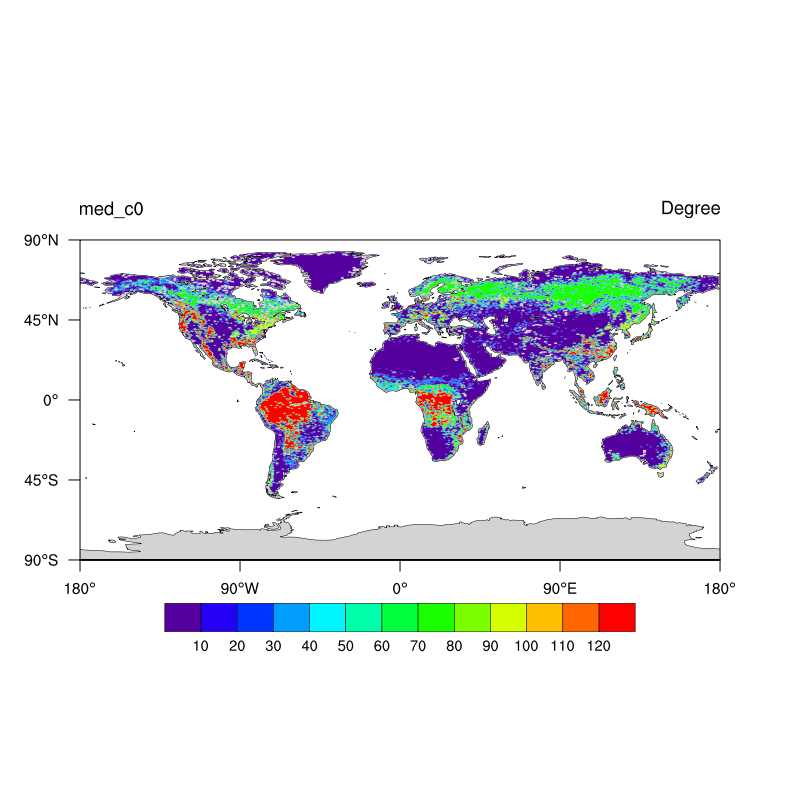
Even though the data has a _FillValue set to -32767 and there are many elements of your data array that are set to the fill value, it appears that there are also a number of values
set to -9999 and -9998 that are out of the range of your actual data. It looks to me like your real data has a range from 0 to 130.
I used the 'where' function to change values less than -9997 to the fill value.
I have attached a modified version of your script that gives a reasonable plot of your data.
You do not need to to the lonFlip.
I strided the data rather severely just so I could get it to plot fast. You can get a higher res plot if you reduce the stride values.
I am also attaching a png of the plot.
-dave
_______________________________________________
ncl-talk mailing list
List instructions, subscriber options, unsubscribe:
http://mailman.ucar.edu/mailman/listinfo/ncl-talk
This archive was generated by hypermail 2.1.8 : Wed Feb 06 2013 - 16:37:00 MST