This is to acknowledge that I got help outside the list and my problem is solved. Thanks for all who looked at my problem.
----- Original Message -----
From: "ncl-talk-request_at_ucar.edu" <ncl-talk-request_at_ucar.edu>
To: ncl-talk_at_ucar.edu
Cc:
Sent: Tuesday, April 30, 2013 11:00 AM
Subject: ncl-talk Digest, Vol 113, Issue 47
Send ncl-talk mailing list submissions to
ĀĀĀ ncl-talk_at_ucar.edu
To subscribe or unsubscribe via the World Wide Web, visit
ĀĀĀ http://mailman.ucar.edu/mailman/listinfo/ncl-talk
or, via email, send a message with subject or body 'help' to
ĀĀĀ ncl-talk-request_at_ucar.edu
You can reach the person managing the list at
ĀĀĀ ncl-talk-owner_at_ucar.edu
When replying, please edit your Subject line so it is more specific
than "Re: Contents of ncl-talk digest..."
Today's Topics:
Ā 1. to read binary data (jeff_at_ucar.edu)
Ā 2. Re: to read binary data (Dave Allured - NOAA Affiliate)
Ā 3. Request (nand_s)
Ā 4. Weather symbol plotting help (zilore mumba)
Ā 5. Re: Weather symbol plotting help (Rick Brownrigg)
Ā 6. Re: Request (Mary Haley)
Ā 7. Re: SUBROUTINE DLNEXTRP in uv2dv_cfd (Dennis Shea)
Ā 8. Re: Polar Map Mask (Jessica Scheick)
Ā 9. How to control Taylor Diagram case labels position?
Ā Ā Ā (mmkamal_at_uwaterloo.ca)
Ā 10. Re: How to control Taylor Diagram case labels position?
Ā Ā Ā (Will Hobbs)
Ā 11. Re: Polar Map Mask (Mary Haley)
Ā 12. Correlation Question (Nkese Mc Shine)
Ā 13. Changing the time units attribute (Marston Johnston)
----------------------------------------------------------------------
Message: 1
Date: Mon, 29 Apr 2013 12:43:29 -0600
From: jeff_at_ucar.edu
Subject: [ncl-talk] to read binary data
To: ncl-talk_at_ucar.edu
Message-ID: <20130429124329.36184yqo6t3iy2j5_at_web3.acd.ucar.edu>
Content-Type: text/plain; charset=ISO-8859-1; DelSp="Yes";
ĀĀĀ format="flowed"
Hi,
A binary data file can be read successfully as the following:
Ā Ā Ā Ā open(11,file=input,status='old',form='unformatted',
Ā Ā Ā +Ā Ā Ā access='direct',recl=nx*ny*nz*4)
Ā Ā Ā Ā irec = 1
Ā Ā Ā Ā do n = 1 , nvar
Ā Ā Ā Ā Ā read(11,rec=irec) var
Ā Ā Ā Ā Ā irec = irec +1
Ā Ā Ā Ā end do
Ā Ā Ā with pgf90 -byteswapio read.f
By NCL I"ve tried, but not successfully,
Ā Ā Ā Ā files = systemfunc("ls ../01_data/*.dat")
Ā Ā Ā Ā setfileoption ("bin", "ReadByteOrder", "LittleEndian")
Ā Ā Ā Ā do ivarĀ = 0,nvar-1
Ā Ā Ā Ā Ā data(:,:,:) = fbindirread(files(0),ivar,(/nz,ny,nx/),"float")
Ā Ā Ā Ā end do
Thanks for any suggestion.
Jeff
----------------------------------------------------------------
This message was sent using IMP, the Internet Messaging Program.
------------------------------
Message: 2
Date: Mon, 29 Apr 2013 14:32:22 -0600
From: Dave Allured - NOAA Affiliate <dave.allured_at_noaa.gov>
Subject: Re: to read binary data
To: jeff_at_ucar.edu
Cc: ncl-talk_at_ucar.edu
Message-ID:
ĀĀĀ <CALqwTFMtHsm2_xRkn1fEupH9XbgOyn5eGgzdGZQWNxSaP1fDww_at_mail.gmail.com>
Content-Type: text/plain; charset=ISO-8859-1
Jeff,
You said "not successfully".Ā What was your symptom?Ā Did you get any
error messages?
--Dave
On Mon, Apr 29, 2013 at 12:43 PM,Ā <jeff_at_ucar.edu> wrote:
> Hi,
>
> A binary data file can be read successfully as the following:
>
>Ā Ā Ā Ā Ā open(11,file=input,status='old',form='unformatted',
>Ā Ā Ā +Ā Ā Ā access='direct',recl=nx*ny*nz*4)
>
>Ā Ā Ā Ā Ā irec = 1
>Ā Ā Ā Ā Ā do n = 1 , nvar
>Ā Ā Ā Ā Ā Ā read(11,rec=irec) var
>Ā Ā Ā Ā Ā Ā irec = irec +1
>Ā Ā Ā Ā Ā end do
>
>Ā Ā Ā with pgf90 -byteswapio read.f
>
>
> By NCL I"ve tried, but not successfully,
>
>Ā Ā Ā Ā Ā files = systemfunc("ls ../01_data/*.dat")
>
>Ā Ā Ā Ā Ā setfileoption ("bin", "ReadByteOrder", "LittleEndian")
>
>Ā Ā Ā Ā do ivarĀ = 0,nvar-1
>
>Ā Ā Ā Ā Ā Ā data(:,:,:) = fbindirread(files(0),ivar,(/nz,ny,nx/),"float")
>
>Ā Ā Ā Ā Ā end do
>
> Thanks for any suggestion.
>
> Jeff
>
> ----------------------------------------------------------------
> This message was sent using IMP, the Internet Messaging Program.
>
> _______________________________________________
> ncl-talk mailing list
> List instructions, subscriber options, unsubscribe:
> http://mailman.ucar.edu/mailman/listinfo/ncl-talk
------------------------------
Message: 3
Date: Mon, 29 Apr 2013 14:50:34 +0000
From: nand_s <sachin.nand_at_usp.ac.fj>
Subject: Request
To: "ncl-talk_at_ucar.edu" <ncl-talk_at_ucar.edu>
Message-ID:
ĀĀĀ <72337BC310441640929317A240FBB9020B14C63E_at_suvxch10mb5.usp.ac.fj>
Content-Type: text/plain; charset="us-ascii"
Am trying to plot the the graph of Argo Floats versus temp difference but the codes I wrote is generating some errors at the moment. Can some please guide me with this? The coding is given below:
load "$NCARG_ROOT/lib/ncarg/nclscripts/csm/gsn_code.ncl"
load "$NCARG_ROOT/lib/ncarg/nclscripts/csm/gsn_csm.ncl"
load "$NCARG_ROOT/lib/ncarg/nclscripts/csm/contributed.ncl"
load "$NCARG_ROOT/lib/ncarg/nclscripts/csm/shea_util.ncl"
begin
;----------------------------------------------------------------------
; Data is hard-coded here. It was originally calculated by running
; a compute-intensive script.
;----------------------------------------------------------------------
Ā floatnames = (/"A","B","C","D","E","F","G"/)
Ā AB = (/-0.477,0,-1.142,-1.032,0.278,0.664,5.819/)
Ā ;B2B1 = (/0,0,-0.482,0,-0.257,0.107,0/)
Ā ;A2A1 = (/0.217,0,-0.66,0.813,0,0.537,-6.024/)
;----------------------------------------------------------------------
; Open a PS file and define the color table
;----------------------------------------------------------------------
Ā colors = (/"blue","green","red"/)
Ā wks = gsn_open_wks ("ps","scatter")
Ā gsn_define_colormap(wks,colors)
;----------------------------------------------------------------------
; Set some plot resources
;----------------------------------------------------------------------
Ā resĀ Ā Ā Ā Ā Ā Ā Ā Ā Ā = True
Ā res_at_gsnDrawĀ Ā Ā Ā Ā Ā = FalseĀ Ā Ā ; Don't draw plot
Ā res_at_gsnFrameĀ Ā Ā Ā Ā = FalseĀ Ā Ā ; Don't advance frame
;
; Don't use gsnMaximize. Instead, we will control
; exactly where plot goes.
;
Ā res_at_vpXFĀ Ā Ā Ā Ā Ā Ā = 0.2
Ā res_at_vpYFĀ Ā Ā Ā Ā Ā Ā = 0.85
Ā res_at_vpWidthFĀ Ā Ā Ā Ā = 0.5
Ā res_at_vpHeightFĀ Ā Ā Ā = 0.5
;---Some calculations to get min/max for Y axis.
Ā miny = min(AB)
Ā maxy = max(AB)
Ā ;minx = min(floatnames)
Ā ;maxx = max(floatnames)
Ā amaxy = maxy - abs(miny)
Ā amaxy = amaxy / 2.
Ā amaxy = amaxy + 25.
Ā aminy = maxy - abs(miny)
Ā aminy = aminy / 2.
Ā aminy = aminy - 25.
;---Resources for X/Y axes.
Ā res_at_trYMinFĀ Ā Ā Ā Ā Ā =Ā aminyĀ Ā Ā Ā Ā Ā Ā ; min value on y-axis
Ā res_at_trYMaxFĀ Ā Ā Ā Ā Ā =Ā amaxyĀ Ā Ā Ā Ā Ā Ā ; max value on y-axis
Ā ;res_at_trXMinFĀ Ā Ā Ā Ā Ā =Ā 0.Ā Ā Ā Ā Ā Ā Ā Ā Ā ; min value on x-axis
Ā ;res_at_trXMaxFĀ Ā Ā Ā Ā Ā =Ā 5.Ā Ā Ā Ā Ā Ā Ā Ā Ā ; max value on x-axis
;---XY marker resources
Ā res_at_xyMarkLineModeĀ Ā = "Markers"
Ā res_at_xyMarkerSizeFĀ Ā Ā = 0.03
Ā res_at_xyMarkerThicknessF = 3.
Ā res_at_xyMonoMarkerColorĀ = FalseĀ Ā Ā Ā Ā ; Allow different colors for markers
Ā res_at_xyMarkerColorsĀ Ā = colors(2:)Ā Ā ; It's okay to list more than
Ā Ā Ā Ā Ā Ā Ā Ā Ā Ā Ā Ā Ā Ā Ā Ā Ā Ā Ā Ā Ā ; you need here
Ā res_at_xyMarkersĀ Ā Ā Ā Ā = (/4,4,4,7,7,7,3,6,6/)
;---Tickmark resources
Ā res_at_tmXBModeĀ Ā Ā Ā = "Manual"
res_at_tmYLModeĀ Ā Ā Ā = "Manual"
Ā res_at_tmXBTickSpacingF = 1.
Ā res_at_tmYLTickSpacingF = 5.
;---Title resources
Ā res_at_tiMainStringĀ Ā Ā = "30 av Annual % Change P vs Delta T~C~" + \
Ā Ā Ā Ā Ā Ā Ā Ā Ā Ā Ā Ā Ā "Ā Ā Ā Ā Ā Ā Ā for the WetSouth"
Ā res_at_tiXAxisStringĀ Ā Ā = "Delta T"
Ā res_at_tiYAxisStringĀ Ā Ā = "% Change P"
Ā res_at_tiMainFontHeightFĀ = 0.03
;----------------------------------------------------------------------
; Create the scatter plot, but don't draw it yet.
;----------------------------------------------------------------------
Ā plot = gsn_csm_xy (wks,transpose((/floatnames,floatnames/)), \
Ā Ā Ā Ā Ā Ā Ā Ā Ā Ā Ā Ā transpose((/AB,AB/)),res)
;----------------------------------------------------------------------
; Draw time stamp first, then the plot.
;----------------------------------------------------------------------
Ā infoTimeStamp(wks,0.005,"")
Ā draw(plot)
Ā frame(wks)Ā Ā ; Now advance the frame.
end
Sachin Ravilesh Nand | Software Engineer (Consultant)
B.C.A (Bangalore University-India)
European Union Global Climate Change Alliance Project.
Pacific Centre for Environment and Sustainable Development.
University of the South Pacific.
E: sachin.nand_at_usp.ac.fj<mailto:sachin.nand_at_usp.ac.fj>
T: (+679) 32 32205
-------------- next part --------------
An HTML attachment was scrubbed...
URL: http://mailman.ucar.edu/pipermail/ncl-talk/attachments/20130429/b1948d79/attachment.html
------------------------------
Message: 4
Date: Mon, 29 Apr 2013 14:02:41 -0700 (PDT)
From: zilore mumba <zmumba_at_yahoo.com>
Subject: [ncl-talk] Weather symbol plotting help
To: "ncl-talk_at_ucar.edu" <ncl-talk_at_ucar.edu>
Message-ID:
ĀĀĀ <1367269361.88154.YahooMailNeo_at_web122401.mail.ne1.yahoo.com>
Content-Type: text/plain; charset="us-ascii"
My sincere apologies for my very rudimentary knowledge of ncl. I modified a script for plotting a weather station model. When I run it with X11 as output, it gives me a map of Rwanda without any plot on it, then when I click it plots on a blank page. With pdf as output I get a plot of stations but without the map.
If someone may spare a bit of their time and correct the line that is not correct in my script, I think I can learn quite a bit about ncl.
Thanks in anticipation
Zilore Mumba
-------------- next part --------------
An HTML attachment was scrubbed...
URL: http://mailman.ucar.edu/pipermail/ncl-talk/attachments/20130429/e9ba9924/attachment.html
-------------- next part --------------
A non-text attachment was scrubbed...
Name: weather_sym_5_11.ncl
Type: application/octet-stream
Size: 1858 bytes
Desc: not available
Url : http://mailman.ucar.edu/pipermail/ncl-talk/attachments/20130429/e9ba9924/attachment.obj
------------------------------
Message: 5
Date: Mon, 29 Apr 2013 15:21:58 -0600
From: Rick Brownrigg <brownrig_at_ucar.edu>
Subject: Re: Weather symbol plotting help
To: zilore mumba <zmumba_at_yahoo.com>
Cc: "ncl-talk_at_ucar.edu" <ncl-talk_at_ucar.edu>
Message-ID: <10ABB3E6-D3AC-4FEF-9F5E-E9E088E64AC3_at_ucar.edu>
Content-Type: text/plain; charset="windows-1252"
Hi Zilore,
Where you define the mpres resources, add:
Ā mpres_at_gsnFrame = False
Then after the call toĀ wmstnm(wks,lats,lons,imdat), add:
Ā frame(wks)
(Also, there's a superfluous call to gsn_open_wks() near the bottom of your script that should be removed).
Hope that helps?
Rick
On Apr 29, 2013, at 3:02 PM, zilore mumba <zmumba_at_yahoo.com> wrote:
> My sincere apologies for my very rudimentary knowledge of ncl. I modified a script for plotting a weather station model. When I run it with X11 as output, it gives me a map of Rwanda without any plot on it, then when I click it plots on a blank page. With pdf as output I get a plot of stations but without the map.
> If someone may spare a bit of their time and correct the line that is not correct in my script, I think I can learn quite a bit about ncl.
> Thanks in anticipation
> Zilore Mumba
> <weather_sym_5_11.ncl>_______________________________________________
> ncl-talk mailing list
> List instructions, subscriber options, unsubscribe:
> http://mailman.ucar.edu/mailman/listinfo/ncl-talk
-------------- next part --------------
An HTML attachment was scrubbed...
URL: http://mailman.ucar.edu/pipermail/ncl-talk/attachments/20130429/f52d1b27/attachment.html
------------------------------
Message: 6
Date: Mon, 29 Apr 2013 15:57:29 -0600
From: Mary Haley <haley_at_ucar.edu>
Subject: Re: Request
To: nand_s <sachin.nand_at_usp.ac.fj>
Cc: "ncl-talk_at_ucar.edu" <ncl-talk_at_ucar.edu>
Message-ID: <D86A47AC-A4AB-4441-A2E8-2C4C04D511F7_at_ucar.edu>
Content-Type: text/plain; charset="us-ascii"
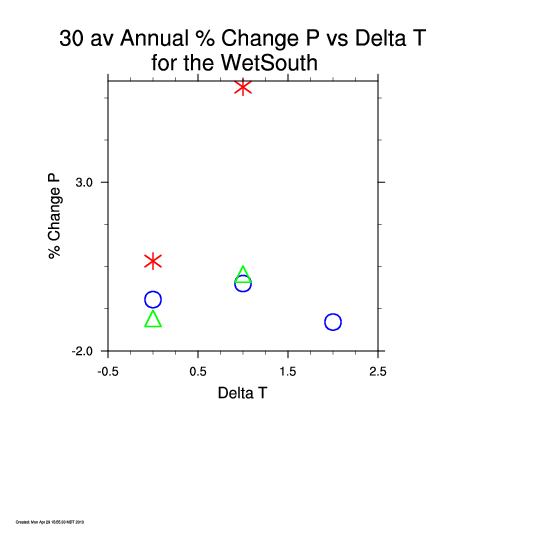
Thanks for including your script.
I'm not sure what you are trying to do with this line:
>Ā plot = gsn_csm_xy (wks,transpose((/floatnames,floatnames/)), \
>Ā Ā Ā Ā Ā Ā Ā Ā Ā Ā Ā Ā Ā transpose((/AB,AB/)),res)
>Ā
The "floatnames" variable is a string, which you cannot pass to gsn_csm_xy for plotting.
The "transpose" function is supposed to be used for transposing a 2D array. For example, converting a 5 x 10 array to be a 10 x 5 array.
AB is a 1D array, so using transpose((/AB,AB/)) will give you an error.
I see that you are trying to create a scatter plot, but it's not clear to me which points you want to be different colors.
For example, you have 7 points in your AB array, but then 9 indexes in your "xyMarkers" array, and only 3 colors in your "colors" array.
If you want each grouping of markers to have a different color and marker style, then you must turn AB into an n x m array, where "n" represents the different groups of markers you want, and "m" represents the most markers you have in any group.Ā If any group doesn't have "m" values, then the rest of the "m" values have to be filled in with missing values.
I don't know what your X axis values are supposed to be, so I used "gsn_csm_y", which just uses index values for the X axis.
See the attached "nand.ncl" script. I arbitrarily took your "AB" array and turned it into a 3 x 3 array, so I could use three different marker styles and colors on it.
--Mary
-------------- next part --------------
A non-text attachment was scrubbed...
Name: nand.ncl
Type: application/octet-stream
Size: 3183 bytes
Desc: not available
Url : http://mailman.ucar.edu/pipermail/ncl-talk/attachments/20130429/ad8fe542/attachment.obj
-------------- next part --------------
A non-text attachment was scrubbed...
Name: scatter.png
Type: image/png
Size: 8030 bytes
Desc: not available
Url : http://mailman.ucar.edu/pipermail/ncl-talk/attachments/20130429/ad8fe542/attachment.png
-------------- next part --------------
> Am trying to plot the the graph of Argo Floats versus temp difference but the codes I wrote is generating some errors at the moment. Can some please guide me with this? The coding is given below:
>Ā
> load "$NCARG_ROOT/lib/ncarg/nclscripts/csm/gsn_code.ncl"
> load "$NCARG_ROOT/lib/ncarg/nclscripts/csm/gsn_csm.ncl"
> load "$NCARG_ROOT/lib/ncarg/nclscripts/csm/contributed.ncl"
> load "$NCARG_ROOT/lib/ncarg/nclscripts/csm/shea_util.ncl"
>Ā
> begin
> ;----------------------------------------------------------------------
> ; Data is hard-coded here. It was originally calculated by running
> ; a compute-intensive script.
> ;----------------------------------------------------------------------
>Ā floatnames = (/"A","B","C","D","E","F","G"/)
>Ā AB = (/-0.477,0,-1.142,-1.032,0.278,0.664,5.819/)
>Ā ;B2B1 = (/0,0,-0.482,0,-0.257,0.107,0/)
>Ā ;A2A1 = (/0.217,0,-0.66,0.813,0,0.537,-6.024/)
> ;----------------------------------------------------------------------
> ; Open a PS file and define the color table
> ;----------------------------------------------------------------------
>Ā
>Ā colors = (/"blue","green","red"/)
>Ā
>Ā wks = gsn_open_wks ("ps","scatter")
>Ā gsn_define_colormap(wks,colors)
>Ā
> ;----------------------------------------------------------------------
> ; Set some plot resources
> ;----------------------------------------------------------------------
>Ā resĀ Ā Ā Ā Ā Ā Ā Ā Ā Ā = True
>Ā
>Ā res_at_gsnDrawĀ Ā Ā Ā Ā Ā = FalseĀ Ā Ā ; Don't draw plot
>Ā res_at_gsnFrameĀ Ā Ā Ā Ā = FalseĀ Ā Ā ; Don't advance frame
>Ā
> ;
> ; Don't use gsnMaximize. Instead, we will control
> ; exactly where plot goes.
> ;
>Ā res_at_vpXFĀ Ā Ā Ā Ā Ā Ā = 0.2
>Ā res_at_vpYFĀ Ā Ā Ā Ā Ā Ā = 0.85
>Ā res_at_vpWidthFĀ Ā Ā Ā Ā = 0.5
>Ā res_at_vpHeightFĀ Ā Ā Ā = 0.5
>Ā
> ;---Some calculations to get min/max for Y axis.
>Ā miny = min(AB)
>Ā maxy = max(AB)
>Ā ;minx = min(floatnames)
>Ā ;maxx = max(floatnames)
>Ā
>Ā amaxy = maxy - abs(miny)
>Ā amaxy = amaxy / 2.
>Ā amaxy = amaxy + 25.
>Ā
>Ā aminy = maxy - abs(miny)
>Ā aminy = aminy / 2.
>Ā aminy = aminy - 25.
>Ā
> ;---Resources for X/Y axes.
>Ā res_at_trYMinFĀ Ā Ā Ā Ā Ā =Ā aminyĀ Ā Ā Ā Ā Ā Ā ; min value on y-axis
>Ā res_at_trYMaxFĀ Ā Ā Ā Ā Ā =Ā amaxyĀ Ā Ā Ā Ā Ā Ā ; max value on y-axis
>Ā ;res_at_trXMinFĀ Ā Ā Ā Ā Ā =Ā 0.Ā Ā Ā Ā Ā Ā Ā Ā Ā ; min value on x-axis
>Ā ;res_at_trXMaxFĀ Ā Ā Ā Ā Ā =Ā 5.Ā Ā Ā Ā Ā Ā Ā Ā Ā ; max value on x-axis
>Ā
> ;---XY marker resources
>Ā res_at_xyMarkLineModeĀ Ā = "Markers"
>Ā res_at_xyMarkerSizeFĀ Ā Ā = 0.03
>Ā res_at_xyMarkerThicknessF = 3.
>Ā res_at_xyMonoMarkerColorĀ = FalseĀ Ā Ā Ā Ā ; Allow different colors for markers
>Ā res_at_xyMarkerColorsĀ Ā = colors(2:)Ā Ā ; It's okay to list more than
>Ā Ā Ā Ā Ā Ā Ā Ā Ā Ā Ā Ā Ā Ā Ā Ā Ā Ā Ā Ā Ā ; you need here
>Ā res_at_xyMarkersĀ Ā Ā Ā Ā = (/4,4,4,7,7,7,3,6,6/)
>Ā
> ;---Tickmark resources
>Ā res_at_tmXBModeĀ Ā Ā Ā = "Manual"
>Ā res_at_tmYLModeĀ Ā Ā Ā = "Manual"
>Ā res_at_tmXBTickSpacingF = 1.
>Ā res_at_tmYLTickSpacingF = 5.
>Ā
> ;---Title resources
>Ā res_at_tiMainStringĀ Ā Ā = "30 av Annual % Change P vs Delta T~C~" + \
>Ā Ā Ā Ā Ā Ā Ā Ā Ā Ā Ā Ā Ā Ā "Ā Ā Ā Ā Ā Ā Ā for the WetSouth"
>Ā res_at_tiXAxisStringĀ Ā Ā = "Delta T"
>Ā res_at_tiYAxisStringĀ Ā Ā = "% Change P"
>Ā res_at_tiMainFontHeightFĀ = 0.03
>Ā
> ;----------------------------------------------------------------------
> ; Create the scatter plot, but don't draw it yet.
> ;----------------------------------------------------------------------
>Ā plot = gsn_csm_xy (wks,transpose((/floatnames,floatnames/)), \
>Ā Ā Ā Ā Ā Ā Ā Ā Ā Ā Ā Ā Ā transpose((/AB,AB/)),res)
>Ā
> ;----------------------------------------------------------------------
> ; Draw time stamp first, then the plot.
> ;----------------------------------------------------------------------
>Ā infoTimeStamp(wks,0.005,"")
>Ā draw(plot)
>Ā frame(wks)Ā Ā ; Now advance the frame.
> end
>Ā
> Sachin Ravilesh Nand | Software Engineer (Consultant)
> B.C.A (Bangalore University-India)
> European Union Global Climate Change Alliance Project.
> Pacific Centre for Environment and Sustainable Development.
> University of the South Pacific.
> E: sachin.nand_at_usp.ac.fj
> T: (+679) 32 32205
>Ā
> _______________________________________________
> ncl-talk mailing list
> List instructions, subscriber options, unsubscribe:
> http://mailman.ucar.edu/mailman/listinfo/ncl-talk
------------------------------
Message: 7
Date: Mon, 29 Apr 2013 17:23:16 -0600
From: Dennis Shea <shea_at_ucar.edu>
Subject: Re: SUBROUTINE DLNEXTRP in uv2dv_cfd
To: Wei-Jen Tseng <tseng.weijen_at_gmail.com>
Cc: ncl-talk_at_ucar.edu
Message-ID: <517F00E4.2060805_at_ucar.edu>
Content-Type: text/plain; charset=windows-1252; format=flowed
Hello Wei-Jen
You are correct. The underlying fortran code had an error.
Ā Ā Ā Ā Ā Ā Ā IF (X(ML,NL).EQ.XMSG) THEN
Ā Ā Ā Ā Ā Ā Ā Ā Ā :
Ā Ā Ā Ā Ā Ā Ā Ā Ā IF (NL.EQ.NLAT .AND. ML.EQ.MLON) THEN
Ā Ā Ā Ā Ā Ā Ā Ā Ā Ā Ā :
+Ā X(ML-1,NL).NE.XMSG) THEN
should be
+Ā X(ML-2,NL).NE.XMSG) THEN
This has been corrected and a fix has been checked in.
Thank You
On 4/27/13 7:12 PM, Wei-Jen Tseng wrote:
> Dear all,
>
> I feel confused when I read the code about the linear extrapolation used in
> the uv2dv_cfd.
>
> The subroutine shows the way to calculate the divergence of 4 corner points.
> I have two questions.
>
> First, the calculations of 2 pointsĀ [NL=1&ML=1, NL=1&ML=MLON] look fine
> because they use 4 another points to get the answer.
> But, the others [NL=NLAT&ML=1, NL=NLAT&ML=MLON] only use 3 points to
> calculate the divergence.!?
> Second, the if-statement and the calculation are not consistent in the
> SUBROUTINE DLNEXTRP.
>
> For example, it is the original code in NCL:
>
> IF (NL.EQ.NLAT .AND. ML.EQ.MLON) THEN
>Ā Ā IF (X(ML,NL-1).NE.XMSG .AND.
> +Ā X(ML,NL-2).NE.XMSG .AND.
> +Ā X(ML-1,NL).NE.XMSG .AND.
> +Ā X(ML-1,NL).NE.XMSG) THEN
>Ā Ā Ā Ā X(ML,NL) =
> (2.D0*X(ML,NL-2)-X(ML,NL-2)+2.D0*X(ML-1,NL)-X(ML-2,NL))*0.5D0
> END IF
> END IF
>
> The corrected code maybe look like this?.?
>
> IF (NL.EQ.NLAT .AND. ML.EQ.MLON) THEN
>Ā Ā IF (X(ML,NL-1).NE.XMSG .AND.
> +Ā X(ML,NL-2).NE.XMSG .AND.
> +Ā X(ML-1,NL).NE.XMSG .AND.
> +Ā X(ML-2,NL).NE.XMSG) THEN
>Ā Ā Ā Ā X(ML,NL) =
> (2.D0*X(ML,NL-1)-X(ML,NL-2)+2.D0*X(ML-1,NL)-X(ML-2,NL))*0.5D0
> END IF
> END IF
>
> I would like to know just the misunderstanding of the code or it's a bug.
> Thank you in advance.
>
> Best regards,
>
> Wei-Jen
>
>
>
> _______________________________________________
> ncl-talk mailing list
> List instructions, subscriber options, unsubscribe:
> http://mailman.ucar.edu/mailman/listinfo/ncl-talk
>
------------------------------
Message: 8
Date: Mon, 29 Apr 2013 22:04:28 -0400
From: Jessica Scheick <jessica.scheick_at_maine.edu>
Subject: Re: Polar Map Mask
To: David Brown <dbrown_at_ucar.edu>, ncl-talk_at_ucar.edu
Message-ID:
ĀĀĀ <CANJnhHQPUPmmhYZ6A4So1GAwvhj0OXc=hfPL5djNbqkJhhUeHA_at_mail.gmail.com>
Content-Type: text/plain; charset="iso-8859-1"
Dave,
Thanks for your suggestions - it took some experimenting but I've been able
to get a stereographic projection sans pole with grid lines and labels. A
rectangular map is fine for my purposes, but can one use any built in
resources to label the lat/lon lines of a map with an elliptical boundary?
Best,
~Jessica
On Thu, Apr 25, 2013 at 3:22 PM, David Brown <dbrown_at_ucar.edu> wrote:
> Hi Jessica,
> I could be wrong, but I think that gsn_csm_map_polar is designed to work
> only with the center of the plot at the north or south pole.
> However you should be able to create a stereographic projection that does
> not include the poles and have grid lines as well as labels if you are
> willing to have rectangular boundaries.
> You will need to play with the resources: mpGridAndLimbOn, mpGridSpacingF
> (or alternatively mpGridLatSpacingF and mpGridLonSpacingF). For tick marks
> and labels set
> pmTickMarkDisplayMode = "always".
>
> If you are still having trouble send us the code as you have it, and also
> if possible a picture or other indicator of the area you are trying to
> focus on.
>Ā -dave
>
>
>
> On Apr 25, 2013, at 1:00 PM, Jessica Scheick <jessica.scheick_at_maine.edu>
> wrote:
>
> Hey everyone,
>
> I've been trying to make a polar map that zooms in on an area that does
> not include the south pole and displays lat/lon gridlines and labels.
>
> Using gsn_csm_map_polar and mpLimitMode=Angles I'm able to generate a mask
> but when I add gridlines they converge to a point at the top of the graph
> (which is not the pole, my center latitude), I can't get them to be
> labeled, and I get errors as follows:
> fatal:NhlCvtStringToEnum: Unable to convert string "missing" to requested
> type
> warning:Error retrieving resource amJust from args - Ignoring Arg
> fatal:NhlCvtStringToEnum: Unable to convert string "missing" to requested
> type
> warning:Error retrieving resource amSide from args - Ignoring Arg
> (if I add in the resources amJust and amSide I also get errors)
>
> Using gsn_csm_map with a stereographic projection and mpLimitMode=Angles
> I'm again able to generate a mask but no gridlines or lat/lon labels.
>
> I'm currently trying to add labels to a mask with a LambertConformal
> projection, though this is not my preferred projection.
>
> Any suggestions? In my perusal of the map examples I haven't found any
> that show a zoomed in mask of a polar region [that doesn't include the
> pole].
>
> Thanks!
> ~Jessica Scheick
>
> jessica.scheick_at_maine.edu
> PhD Student
> IGERT Trainee
> School of Earth and Climate Sciences
> Climate Change Institute
> University of Maine
> Orono, ME
> _______________________________________________
> ncl-talk mailing list
> List instructions, subscriber options, unsubscribe:
> http://mailman.ucar.edu/mailman/listinfo/ncl-talk
>
>
>
-------------- next part --------------
An HTML attachment was scrubbed...
URL: http://mailman.ucar.edu/pipermail/ncl-talk/attachments/20130429/005e841e/attachment.html
------------------------------
Message: 9
Date: Mon, 29 Apr 2013 23:00:31 -0400
From: mmkamal_at_uwaterloo.ca
Subject: How to control Taylor Diagram case labels
ĀĀĀ position?
To: "ncl-talk_at_ucar.edu" <ncl-talk_at_ucar.edu>
Message-ID:
ĀĀĀ <20130429230031.13981jpadqu24sm8_at_www.nexusmail.uwaterloo.ca>
Content-Type: text/plain; charset="iso-8859-1"
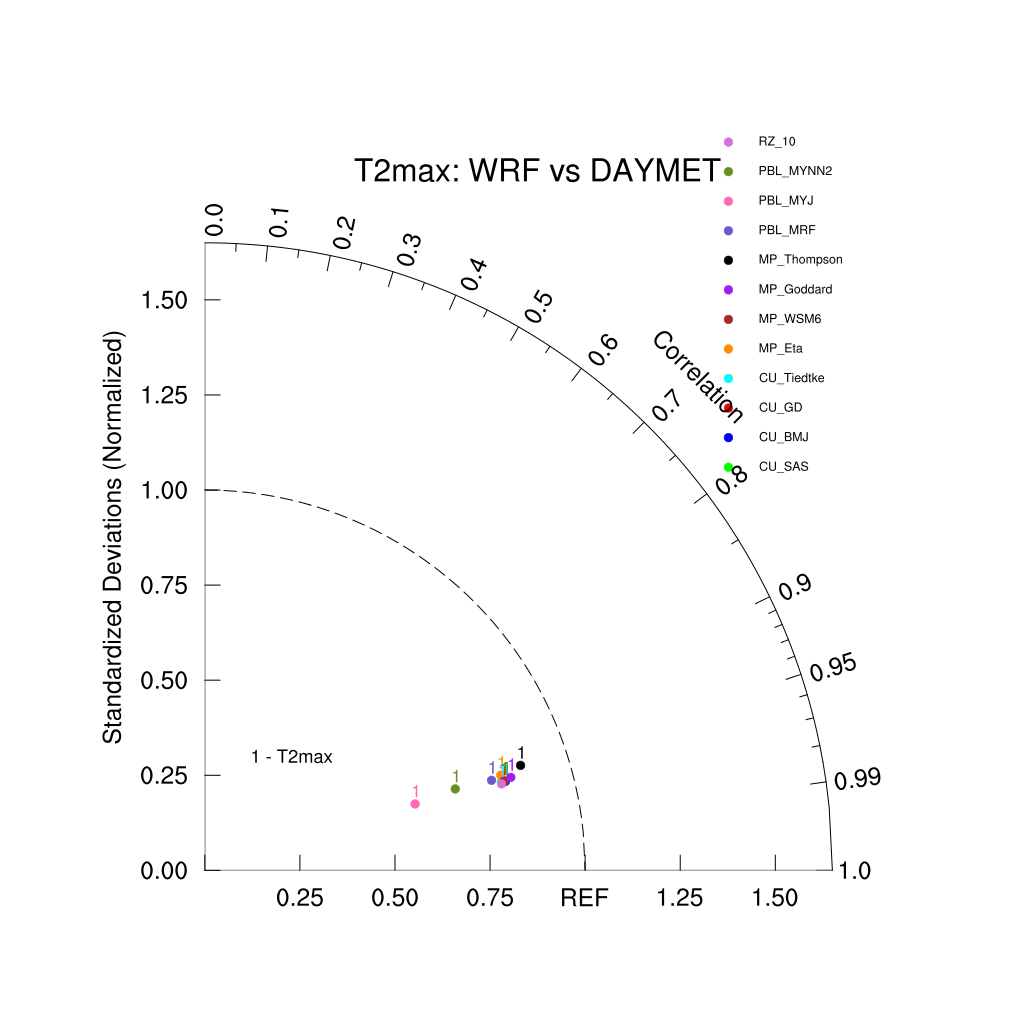
Hi,
I am struggling to control the position of the case labels. I wouldĀ
like to shift the position of the case labels both to the right andĀ
little up. But I have failed to do so. I look forward to hearing fromĀ
you. Here I am attaching my plot for your convenience.
Thanks
Kamal
-------------- next part --------------
A non-text attachment was scrubbed...
Name: Taylor_WRF_vs_DAYMET.000001.png
Type: image/png
Size: 93881 bytes
Desc: not available
Url : http://mailman.ucar.edu/pipermail/ncl-talk/attachments/20130429/27cc7a20/attachment.png
------------------------------
Message: 10
Date: Tue, 30 Apr 2013 03:17:12 +0000
From: Will Hobbs <Will.Hobbs_at_utas.edu.au>
Subject: Re: [ncl-talk] How to control Taylor Diagram case labels
ĀĀĀ position?
To: "mmkamal_at_uwaterloo.ca" <mmkamal_at_uwaterloo.ca>,ĀĀĀ "ncl-talk_at_ucar.edu"
ĀĀĀ <ncl-talk_at_ucar.edu>
Message-ID:
ĀĀĀ <7B230BB1F8E9BD449F56BA16FC664F793AD753B4_at_MBXSBYN5.utas.ad.internal>
Content-Type: text/plain; CHARSET=US-ASCII
Kamal
By 'case labels' do you mean the position of the legend in your plot, or
the the marker labels?
If the former, use the annotation resources 'amres_at_amParallelPosF' and
'amres_at_amOrthogonalPosF' in part 5 of the the script taylor_diagram.ncl,
to move the legend around.
If the latter, you can change the vertical position of the marker labels
when you call taylor_diagram.ncl using the resource rOpt_at_markerTxYOffset.
I can't find an equivalent for horizontal alignment in the taylor diagram
script so will have to add it yourself (Part 4 of the taylor_diagram.ncl
script)
On 30/04/13 1:00 PM, "mmkamal_at_uwaterloo.ca" <mmkamal_at_uwaterloo.ca> wrote:
>Hi,
>
>I am struggling to control the position of the case labels. I would
>like to shift the position of the case labels both to the right and
>little up. But I have failed to do so. I look forward to hearing from
>you. Here I am attaching my plot for your convenience.
>
>
>Thanks
>Kamal
>
>
>
>
>
>
------------------------------
Message: 11
Date: Mon, 29 Apr 2013 22:17:44 -0600
From: Mary Haley <haley_at_ucar.edu>
Subject: Re: Polar Map Mask
To: Jessica Scheick <jessica.scheick_at_maine.edu>
Cc: David Brown <dbrown_at_ucar.edu>, ncl-talk_at_ucar.edu
Message-ID: <E2EE1D83-9025-443B-8C94-1D75F60EFC81_at_ucar.edu>
Content-Type: text/plain; charset="iso-8859-1"
Jessica,
Dave is correct, the gsn_csm_xxx_polar functions only work with center of the plot at one of the poles.
There's no way to get automatic tickmarks on a non-rectangular map projection. The polar map labels are done with calls to gsn_text_ndc.
We have examples of adding your own lat/lon labels to a map. See examples mptick_10.ncl, mptick_9.ncl, and, for your purpose, mptick_12.ncl, which labels a somewhat ellipitcally shaped map, the Robinson projection.
http://www.ncl.ucar.edu/Applications/mptick.shtml
--Mary
On Apr 29, 2013, at 8:04 PM, Jessica Scheick <jessica.scheick_at_maine.edu> wrote:
> Dave,
>
> Thanks for your suggestions - it took some experimenting but I've been able to get a stereographic projection sans pole with grid lines and labels. A rectangular map is fine for my purposes, but can one use any built in resources to label the lat/lon lines of a map with an elliptical boundary?
>
> Best,
> ~Jessica
>
>
> On Thu, Apr 25, 2013 at 3:22 PM, David Brown <dbrown_at_ucar.edu> wrote:
> Hi Jessica,
> I could be wrong, but I think that gsn_csm_map_polar is designed to work only with the center of the plot at the north or south pole.
> However you should be able to create a stereographic projection that does not include the poles and have grid lines as well as labels if you are willing to have rectangular boundaries.
> You will need to play with the resources: mpGridAndLimbOn, mpGridSpacingF (or alternatively mpGridLatSpacingF and mpGridLonSpacingF). For tick marks and labels set
> pmTickMarkDisplayMode = "always".
>
> If you are still having trouble send us the code as you have it, and also if possible a picture or other indicator of the area you are trying to focus on.
>Ā -dave
>
>
>
> On Apr 25, 2013, at 1:00 PM, Jessica Scheick <jessica.scheick_at_maine.edu> wrote:
>
>> Hey everyone,
>>
>> I've been trying to make a polar map that zooms in on an area that does not include the south pole and displays lat/lon gridlines and labels.
>>
>> Using gsn_csm_map_polar and mpLimitMode=Angles I'm able to generate a mask but when I add gridlines they converge to a point at the top of the graph (which is not the pole, my center latitude), I can't get them to be labeled, and I get errors as follows:
>> fatal:NhlCvtStringToEnum: Unable to convert string "missing" to requested type
>> warning:Error retrieving resource amJust from args - Ignoring Arg
>> fatal:NhlCvtStringToEnum: Unable to convert string "missing" to requested type
>> warning:Error retrieving resource amSide from args - Ignoring Arg
>> (if I add in the resources amJust and amSide I also get errors)
>>
>> Using gsn_csm_map with a stereographic projection and mpLimitMode=Angles I'm again able to generate a mask but no gridlines or lat/lon labels.
>>
>> I'm currently trying to add labels to a mask with a LambertConformal projection, though this is not my preferred projection.
>>
>> Any suggestions? In my perusal of the map examples I haven't found any that show a zoomed in mask of a polar region [that doesn't include the pole].
>>
>> Thanks!
>> ~Jessica Scheick
>>
>> jessica.scheick_at_maine.edu
>> PhD Student
>> IGERT Trainee
>> School of Earth and Climate Sciences
>> Climate Change Institute
>> University of Maine
>> Orono, ME
>> _______________________________________________
>> ncl-talk mailing list
>> List instructions, subscriber options, unsubscribe:
>> http://mailman.ucar.edu/mailman/listinfo/ncl-talk
>
>
> _______________________________________________
> ncl-talk mailing list
> List instructions, subscriber options, unsubscribe:
> http://mailman.ucar.edu/mailman/listinfo/ncl-talk
-------------- next part --------------
An HTML attachment was scrubbed...
URL: http://mailman.ucar.edu/pipermail/ncl-talk/attachments/20130429/55d008dc/attachment.html
------------------------------
Message: 12
Date: Tue, 30 Apr 2013 14:11:00 +0000
From: Nkese Mc Shine <Nkese.McShine_at_sta.uwi.edu>
Subject: Correlation Question
To: "ncl-talk_at_ucar.edu" <ncl-talk_at_ucar.edu>
Message-ID:
ĀĀĀ <7368311F6A984441893E050C8422DDBA3126C5D6_at_exMS01vm.sauwi.uwi.tt>
Content-Type: text/plain; charset="iso-8859-1"
Dear All,
I would like to make a month to month correlation. I would like to correlate 1 month of sst(lat,lon,time) with 1 month of precipitation which actually is 1 value. Is it possible? Attached is my script and below is the output. Please let me know, what I can do if it is possible.
Variable: sst_anom
Type: float
Total Size: 105408000 bytes
Ā Ā Ā Ā Ā Ā 26352000 values
Number of Dimensions: 3
Dimensions and sizes:Ā Ā [lat | 100] x [lon | 360] x [time | 732]
Coordinates:
Ā Ā Ā Ā Ā Ā lat: [49.5..-49.5]
Ā Ā Ā Ā Ā Ā lon: [-179.5..179.5]
Ā Ā Ā Ā Ā Ā time: [194601..200612]
Number Of Attributes: 12
Ā anomaly_op_ncl :Ā Ā Annual Cycle Removed:function rmMonAnnCycLLT:contributed.ncl
Ā description :Ā Ā HadISST 1.1 monthly average sea surface temperature
Ā actual_range :Ā Ā ( -1.8, 34.76296 )
Ā missing_value :Ā Ā -1e+30
Ā _FillValue :Ā Ā -1e+30
Ā scale_factor :Ā Ā 1
Ā cell_methods :Ā Ā time: lat: lon: mean
Ā add_offset :Ā Ā 0
Ā units :Ā Ā degC
Ā standard_name :Ā Ā sea_surface_temperature
Ā long_name :Ā Ā Monthly 1 degree resolution SST
Ā reference :Ā Ā function rmMonAnnCycLLT in contrib.ncl
(0)
(0)Ā Ā Monthly 1 degree resolution SST: min=-8.70077Ā max=6.98223
Variable: sst_anom_jan
Type: float
Total Size: 144000 bytes
Ā Ā Ā Ā Ā Ā 36000 values
Number of Dimensions: 3
Dimensions and sizes:Ā Ā [lat | 100] x [lon | 360] x [time | 1]
Coordinates:
Ā Ā Ā Ā Ā Ā lat: [49.5..-49.5]
Ā Ā Ā Ā Ā Ā lon: [-179.5..179.5]
Ā Ā Ā Ā Ā Ā time: [199301..199301]
Number Of Attributes: 12
Ā reference :Ā Ā function rmMonAnnCycLLT in contrib.ncl
Ā long_name :Ā Ā Monthly 1 degree resolution SST
Ā standard_name :Ā Ā sea_surface_temperature
Ā units :Ā Ā degC
Ā add_offset :Ā Ā 0
Ā cell_methods :Ā Ā time: lat: lon: mean
Ā scale_factor :Ā Ā 1
Ā _FillValue :Ā Ā -1e+30
Ā missing_value :Ā Ā -1e+30
Ā actual_range :Ā Ā ( -1.8, 34.76296 )
Ā description :Ā Ā HadISST 1.1 monthly average sea surface temperature
Ā anomaly_op_ncl :Ā Ā Annual Cycle Removed:function rmMonAnnCycLLT:contributed.ncl
(0)
(0)Ā Ā Monthly 1 degree resolution SST: min=-2.4631Ā max=2.59599
Variable: precipanom_data_ts
Type: float
Total Size: 2928 bytes
Ā Ā Ā Ā Ā Ā 732 values
Number of Dimensions: 1
Dimensions and sizes:Ā Ā [time | 732]
Coordinates:
Ā Ā Ā Ā Ā Ā time: [194601..200612]
Number Of Attributes: 1
Ā _FillValue :Ā Ā 9.96921e+36
(0)
(0)Ā Ā min=-1.73324Ā max=3.01711
Variable: precipJJA1993
Type: float
Total Size: 4 bytes
Ā Ā Ā Ā Ā Ā 1 values
Number of Dimensions: 1
Dimensions and sizes:Ā Ā [time | 1]
Coordinates:
Ā Ā Ā Ā Ā Ā time: [199307..199307]
Number Of Attributes: 2
Ā _FillValue :Ā Ā 9.96921e+36
Ā NMO :Ā Ā 6
(0)
(0)Ā Ā min=0.267831Ā max=0.267831
warning:escorc: Non-fatal conditions encountered in series or xstd equals zero.
Possibly, all values of a series are constant.
warning:escorc: Most likely, one or more series consisted of all constant values
Variable: corr
Type: float
Total Size: 144000 bytes
Ā Ā Ā Ā Ā Ā 36000 values
Number of Dimensions: 2
Dimensions and sizes:Ā Ā [100] x [360]
Coordinates:
Number Of Attributes: 1
Ā _FillValue :Ā Ā -1e+30
(0)
(0)Ā Ā min=-1e+30Ā max=-1e+30
Regards,
Nkese.
CONFIDENTIALITY:Ā This email (including any attachments) may contain confidential, proprietary and/or privileged information.Ā Any duplication, copying, distribution, dissemination, transmission, disclosure or use in any manner of this email (including any attachments) without the authorisation of the sender is strictly prohibited.Ā If you receive this email (including any attachments) in error, please notify the sender and delete this email (including any attachments) from your system.Ā Thank you.
-------------- next part --------------
An HTML attachment was scrubbed...
URL: http://mailman.ucar.edu/pipermail/ncl-talk/attachments/20130430/2ec971c0/attachment.html
-------------- next part --------------
A non-text attachment was scrubbed...
Name: month05.ncl
Type: application/octet-stream
Size: 2936 bytes
Desc: month05.ncl
Url : http://mailman.ucar.edu/pipermail/ncl-talk/attachments/20130430/2ec971c0/attachment.obj
------------------------------
Message: 13
Date: Tue, 30 Apr 2013 18:41:53 +0200
From: Marston Johnston <shejo284_at_gmail.com>
Subject: [ncl-talk] Changing the time units attribute
To: ncl-talk_at_ucar.edu
Message-ID:
ĀĀĀ <CAK68gpvRvBYUmGMRMmTd0LzDmSYYkToCrvOtAGJ=u7ZtfnZgGg_at_mail.gmail.com>
Content-Type: text/plain; charset="iso-8859-1"
Hi,
I want to change the time attributes in my NETCDF file in a manner
similar to this:
time = (/3356, 3356.083, 3356.333, 3356.917, 3357.042, 3358.208/)
Ā time_at_units = "days since 1995-01-01 00:00:0.0",
only I would like to use fspan(0,17517,5840).
The problem is that I cannot add the attributes. It is not possible to
use the "@" with an array created using fspan since I have 5840 time
steps.
How can I do this in ncl?
/Marston
--
Only the fruitful thing is true!
-------------- next part --------------
An HTML attachment was scrubbed...
URL: http://mailman.ucar.edu/pipermail/ncl-talk/attachments/20130430/1210588f/attachment.html
------------------------------
_______________________________________________
ncl-talk mailing list
ncl-talk_at_ucar.edu
http://mailman.ucar.edu/mailman/listinfo/ncl-talk
End of ncl-talk Digest, Vol 113, Issue 47
*****************************************
_______________________________________________
ncl-talk mailing list
List instructions, subscriber options, unsubscribe:
http://mailman.ucar.edu/mailman/listinfo/ncl-talk
Received on Tue Apr 30 22:49:22 2013
This archive was generated by hypermail 2.1.8 : Thu May 02 2013 - 11:16:45 MDT