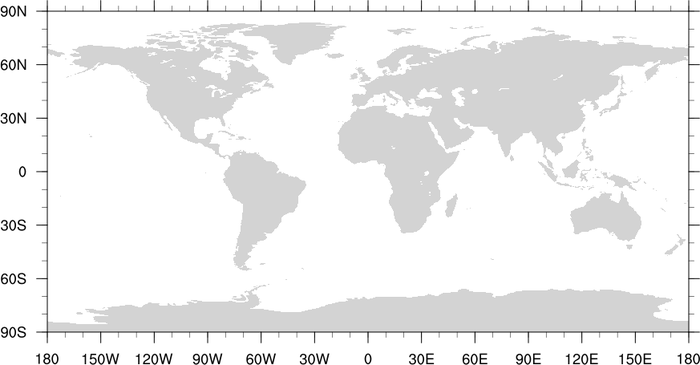
In NCL version 4.2.0.a23, some built in tickmarks have been added to the language. To get these tickmarks, you need to set pmTickMarkDisplayMode = "Always". Not all of the tick mark resources are available for maps.
NCL Home>
Application examples>
Maps
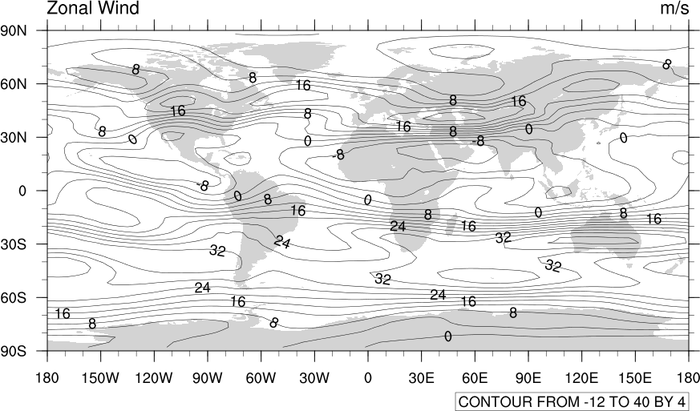
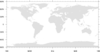
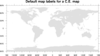
 mptick_2.ncl: Turns on the
tickmarks available in NCL version 4.2.0.a23 and later.
mptick_2.ncl: Turns on the
tickmarks available in NCL version 4.2.0.a23 and later.
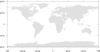
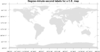
 mptick_3.ncl: Demonstrates what
happens to the built-in tickmarks when you zoom in to less than one
degree.
mptick_3.ncl: Demonstrates what
happens to the built-in tickmarks when you zoom in to less than one
degree.
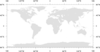
 mptick_4.ncl: Demonstrates how to
adjust the tickmark spacing. This only works for the default tickmarks
(see example 1)
mptick_4.ncl: Demonstrates how to
adjust the tickmark spacing. This only works for the default tickmarks
(see example 1)
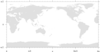
 mptick_5.ncl: Demonstrates how to
change the tickmark label font height, adjust the tickmark length,
and turn on grid lines (a map resource). This works for both the
default and built-in tickmarks.
mptick_5.ncl: Demonstrates how to
change the tickmark label font height, adjust the tickmark length,
and turn on grid lines (a map resource). This works for both the
default and built-in tickmarks.
 mptick_6.ncl: Demonstrates
how to change the default "0" to a "EQ"
mptick_6.ncl: Demonstrates
how to change the default "0" to a "EQ"
 mptick_7.ncl: Demonstrates
how to get a degree symbol in the map tickmark labels, and how to
turn on labels for the top and right axes.
mptick_7.ncl: Demonstrates
how to get a degree symbol in the map tickmark labels, and how to
turn on labels for the top and right axes.
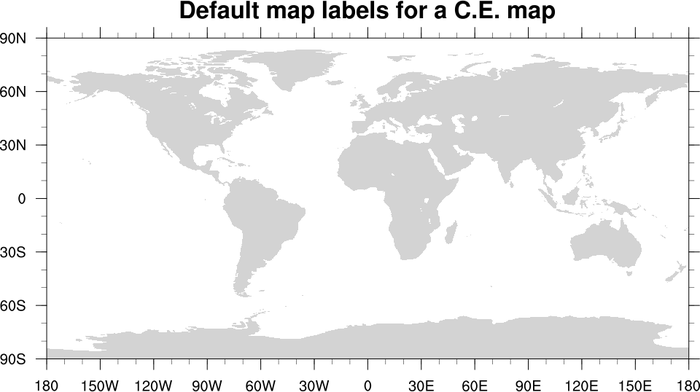
 mptick_8.ncl: Demonstrates
how to change the labels on a cylindrical equidistant map.
This method only works for CE maps!
mptick_8.ncl: Demonstrates
how to change the labels on a cylindrical equidistant map.
This method only works for CE maps!
 mptick_9.ncl: Demonstrates
how to explicitly label the axes with the tickmarks and labels
you want. You can use this for rectangular map projections only.
mptick_9.ncl: Demonstrates
how to explicitly label the axes with the tickmarks and labels
you want. You can use this for rectangular map projections only.
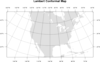
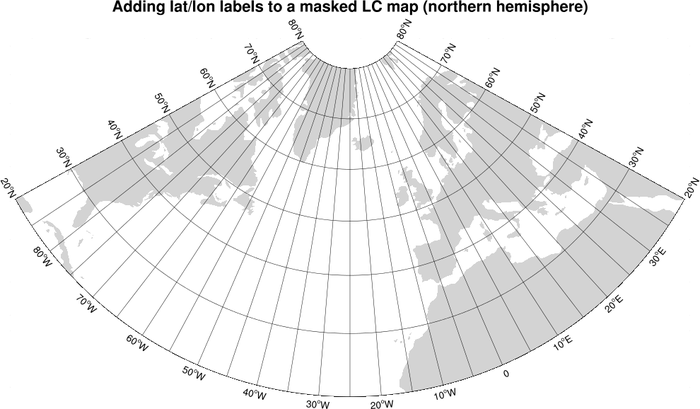
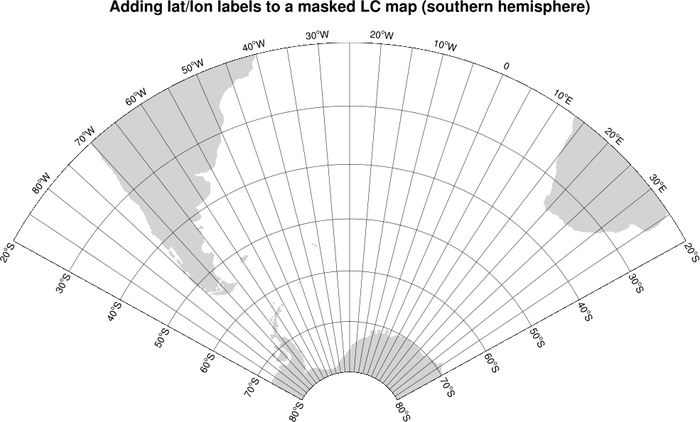
 mptick_10.ncl: Shows how to add your
own longitude/latitude labels to a masked Lambert Conformal plot.
The gsn_add_text function is used to attach the labels. The
angle of the strings is calculated by converting lat/lon values to NDC
space (datatondc) and then
using atan to get the angle.
mptick_10.ncl: Shows how to add your
own longitude/latitude labels to a masked Lambert Conformal plot.
The gsn_add_text function is used to attach the labels. The
angle of the strings is calculated by converting lat/lon values to NDC
space (datatondc) and then
using atan to get the angle.
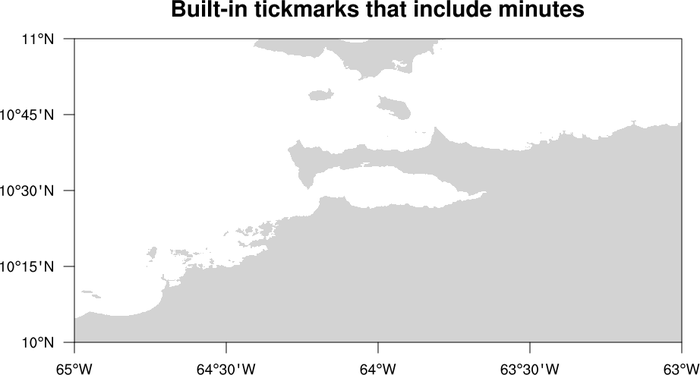
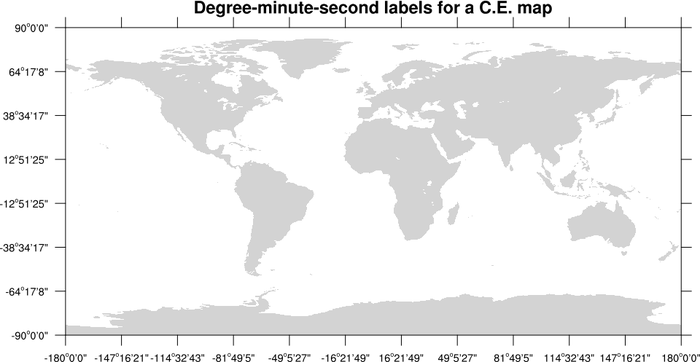
 mptick_11.ncl: Demonstrates
how to explicitly label map tickmarks with degrees-minutes-seconds
type of labels. This example only works for
cylindrical equdistant maps.
mptick_11.ncl: Demonstrates
how to explicitly label map tickmarks with degrees-minutes-seconds
type of labels. This example only works for
cylindrical equdistant maps.
 mptick_12.ncl: Demonstrates
adding tickmarks to a Robinson map.
mptick_12.ncl: Demonstrates
adding tickmarks to a Robinson map.
NCL Graphics: Map Tickmarks
Two plot templates categories (cylindrical
equidistant and polar stereographic
projections) come with "nice" lat/lon labels. These have been manually
added by the developers.
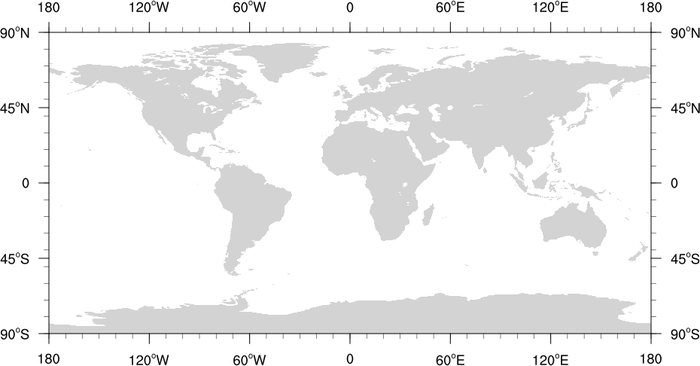
 mptick_2.ncl: Turns on the
tickmarks available in NCL version 4.2.0.a23 and later.
mptick_2.ncl: Turns on the
tickmarks available in NCL version 4.2.0.a23 and later.
pmTickMarkDisplayMode = "Always" will turn on these tickmarks.
The built-in tickmarks contain a degree symbol.
 mptick_3.ncl: Demonstrates what
happens to the built-in tickmarks when you zoom in to less than one
degree.
mptick_3.ncl: Demonstrates what
happens to the built-in tickmarks when you zoom in to less than one
degree.
 mptick_4.ncl: Demonstrates how to
adjust the tickmark spacing. This only works for the default tickmarks
(see example 1)
mptick_4.ncl: Demonstrates how to
adjust the tickmark spacing. This only works for the default tickmarks
(see example 1)
gsnMajorLatSpacing, gsnMinorLatSpacing, gsnMajorLonSpacing, gsnMinorLonSpacing, can be used to adjust the spacing of the default tickmarks on a ce map projection.
tmXBMinorOn, tmXTMinorOn, tmYLMinorOn, tmYRMinorOn, can be used to turn off the minor tickmarks on a particular side of a map projection.
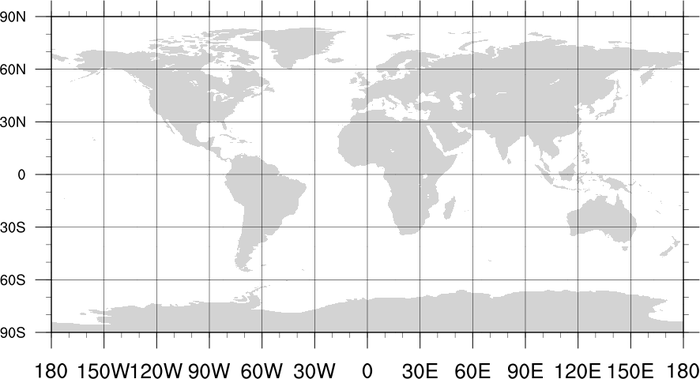 mptick_5.ncl: Demonstrates how to
change the tickmark label font height, adjust the tickmark length,
and turn on grid lines (a map resource). This works for both the
default and built-in tickmarks.
mptick_5.ncl: Demonstrates how to
change the tickmark label font height, adjust the tickmark length,
and turn on grid lines (a map resource). This works for both the
default and built-in tickmarks.
tmXBLabelFontHeightF and its relatives (XT,YL etc) adjust the font height of tickmark labels.
tmXBMajorLengthF and adjusts the tickmark length. The plot template is designed such that changing one tickmark length (e.g. XB), changes them all.
mpGridAndLimbOn turns on the grid lines. This is a function of the map and not tickmarks. Note that there are numerous other mpGrid* resources that control its spacing and appearance.
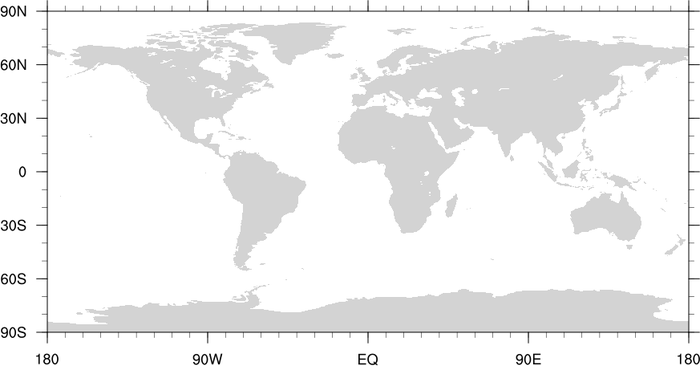 mptick_6.ncl: Demonstrates
how to change the default "0" to a "EQ"
mptick_6.ncl: Demonstrates
how to change the default "0" to a "EQ"
To do this change, you must explicitly define the tickmarks and their
labels using:
tmXBMode =
"Explicit"
tmXBValues =
(/.../)
tmXBLabels = (/.../)
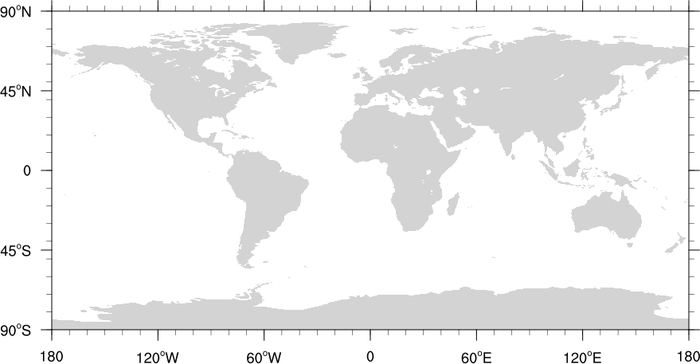
 mptick_7.ncl: Demonstrates
how to get a degree symbol in the map tickmark labels, and how to
turn on labels for the top and right axes.
mptick_7.ncl: Demonstrates
how to get a degree symbol in the map tickmark labels, and how to
turn on labels for the top and right axes.
You must first explicitly define the tickmarks and their labels as defined in example 6 above, and then use text function codes to get a degree symbol. Set tmXTLabelsOn and tmYRLabelsOn to True to get tickmark labels on the top and right axes. Note that setting pmTickMarkDisplayMode = "Always" will also have the effect of giving you map tickmark labels with degree symbols (see example 2).
 mptick_8.ncl: Demonstrates
how to change the labels on a cylindrical equidistant map.
This method only works for CE maps!
mptick_8.ncl: Demonstrates
how to change the labels on a cylindrical equidistant map.
This method only works for CE maps!
To do this change, you must explicitly define the bottom tickmarks and
their labels using:
tmXBMode =
"Explicit"
tmXBValues =
(/.../)
tmXBLabels = (/.../).
Ditto for the right Y labels using:
tmYLMode = "Explicit"
tmYLValues = (/.../)
tmYLLabels = (/.../)
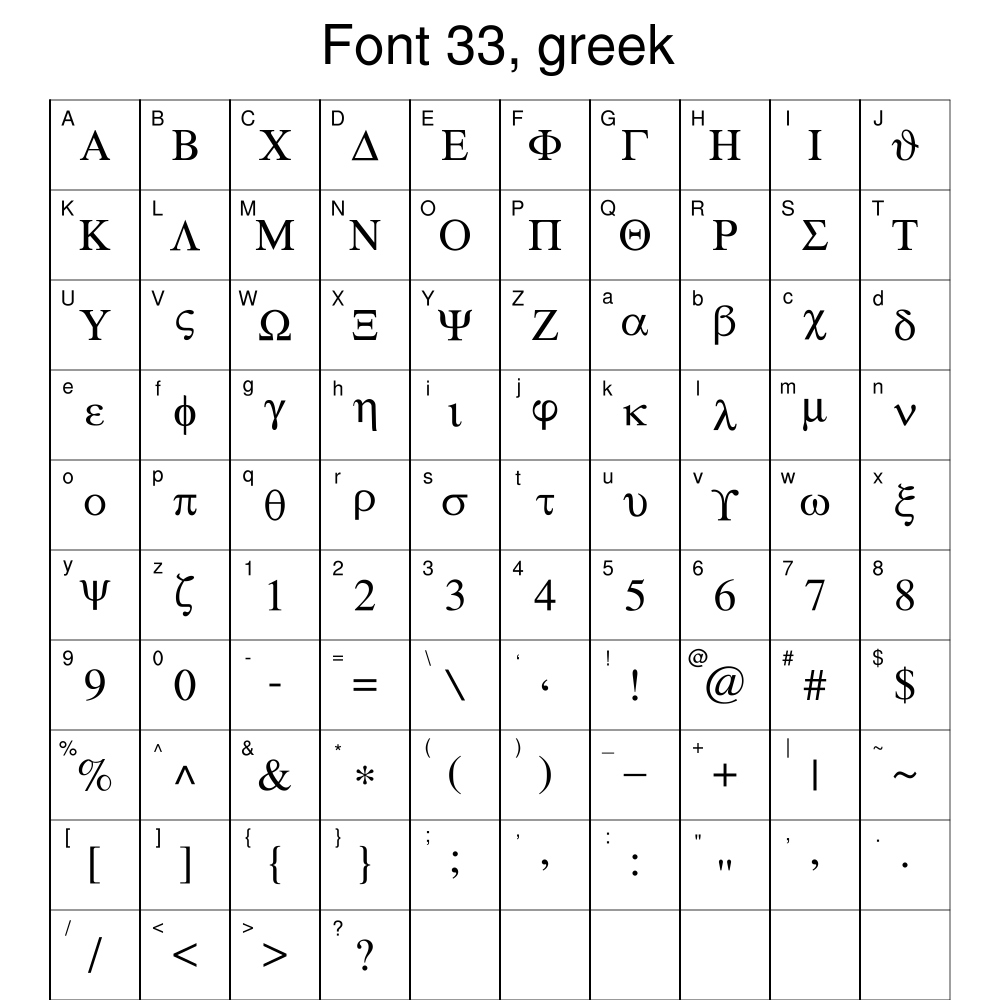
In this example, the "F" function code is being used to switch to the Greek font table (font table 33) in order to get the "pi" symbol.
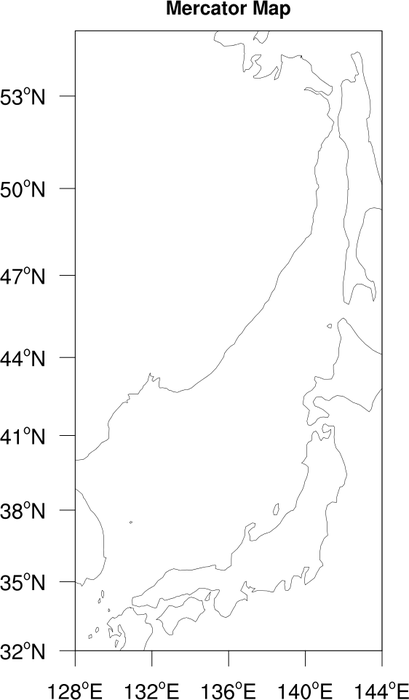 mptick_9.ncl: Demonstrates
how to explicitly label the axes with the tickmarks and labels
you want. You can use this for rectangular map projections only.
mptick_9.ncl: Demonstrates
how to explicitly label the axes with the tickmarks and labels
you want. You can use this for rectangular map projections only.
To use, copy the "add_map_tickmarks" function to your own code, and then set the locations where you want tickmarks by setting one or more of these resources:
  res@tmYLValues = ...
  res@tmYRValues = ...
  res@tmXBValues = ...
  res@tmXTValues = ...
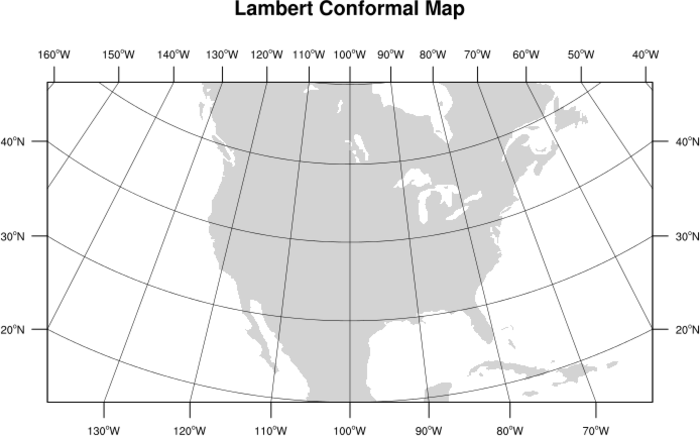
 mptick_10.ncl: Shows how to add your
own longitude/latitude labels to a masked Lambert Conformal plot.
The gsn_add_text function is used to attach the labels. The
angle of the strings is calculated by converting lat/lon values to NDC
space (datatondc) and then
using atan to get the angle.
mptick_10.ncl: Shows how to add your
own longitude/latitude labels to a masked Lambert Conformal plot.
The gsn_add_text function is used to attach the labels. The
angle of the strings is calculated by converting lat/lon values to NDC
space (datatondc) and then
using atan to get the angle.
 mptick_11.ncl: Demonstrates
how to explicitly label map tickmarks with degrees-minutes-seconds
type of labels. This example only works for
cylindrical equdistant maps.
mptick_11.ncl: Demonstrates
how to explicitly label map tickmarks with degrees-minutes-seconds
type of labels. This example only works for
cylindrical equdistant maps.
If you want to do something like this for other map projections see examples 9 and 10. You will have to change the corresponding tmXBLabels, tmXTLabels, tmYLLabels, tmYRLabels resources.
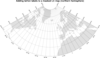
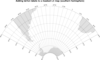
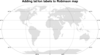
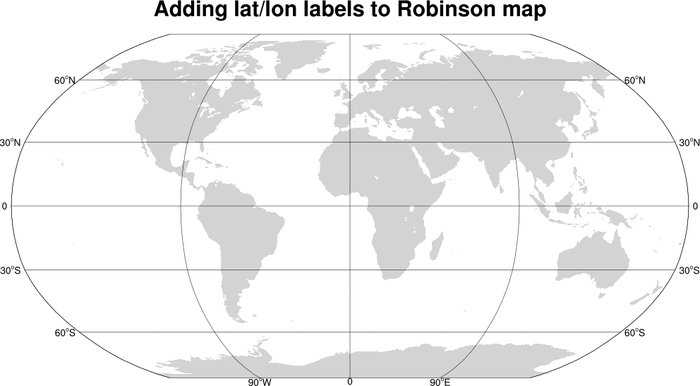 mptick_12.ncl: Demonstrates
adding tickmarks to a Robinson map.
mptick_12.ncl: Demonstrates
adding tickmarks to a Robinson map.
The gsn_add_text function is used to attach the labels. No labels are added at lat = abs(90) or lon = abs(180). Extra spacing is added after the left labels, and before the right labels so they don't run into the map.