Date: Thu Dec 12 2013 - 11:14:59 MST
Ok Thanks, It still will not working and I am not sure what is wrong. I
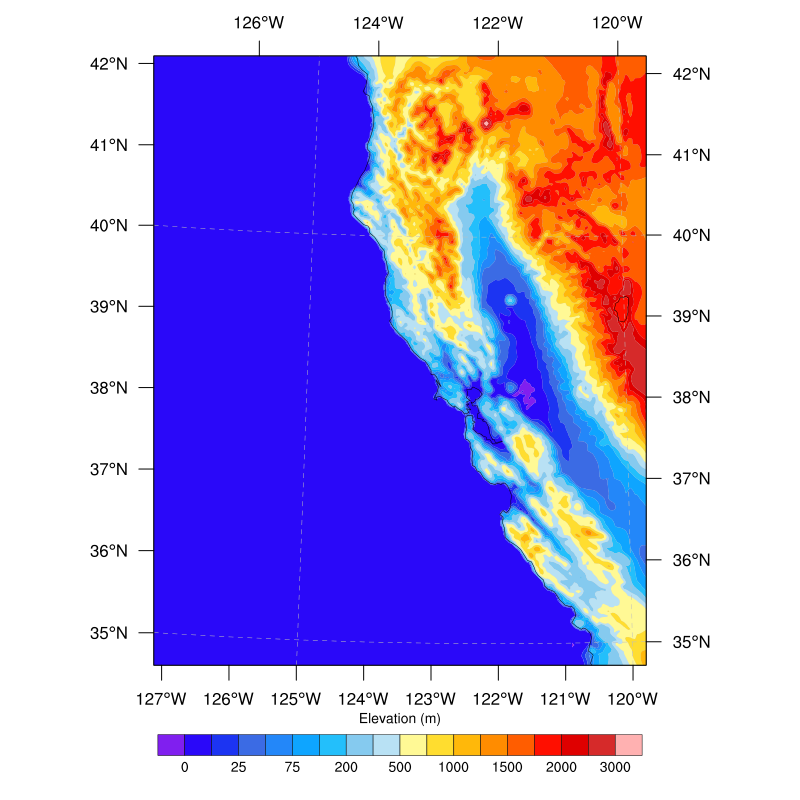
will put the code below and attach the image:
load "$NCARG_ROOT/lib/ncarg/nclscripts/csm/gsn_code.ncl"
load "$NCARG_ROOT/lib/ncarg/nclscripts/csm/gsn_csm.ncl"
load "$NCARG_ROOT/lib/ncarg/nclscripts/wrf/WRFUserARW.ncl"
;load "./WRFUserARW.ncl"
begin
type="png"
wks = gsn_open_wks(type, "cx_line1") ; Open graphics file
d2 = addfile("/data2/eiserloh/data/AR/run3.1/wrfout_d02_2012-11-28_00:00:
00.nc", "r")
terr = wrf_user_getvar(d2,"HGT_M",0)
lat2 = wrf_user_getvar(d2,"XLAT",0)
lon2 = wrf_user_getvar(d2,"XLONG",0)
terr@lat2d = lat2
terr@lon2d = lon2
dom_dims = dimsizes(terr)
nx2 = dom_dims(1) - 1
ny2 = dom_dims(0) - 1
res = True
; Set some contouring resources.
res@cnFillOn = True
res@cnLinesOn = False
res@cnLineLabelsOn = False
res@cnInfoLabelOn = False
res@gsnSpreadColors = True
res@cnLevelSelectionMode = "ExplicitLevels"
res@cnLevels = (/0, 10, 25, 50, 75, 125, 200, 350, 500, 750, \
1000, 1250, 1500, 1750, 2000, 2250, 3000/)
res@gsnLeftString = ""
res@gsnRightString = ""
res@gsnDraw = False
res@gsnFrame = False
; Add map resources
res@mpDataBaseVersion = "MediumRes" ; Default is LowRes
res@mpOutlineDrawOrder = "PostDraw" ; Draw map outlines last
res@mpGridAndLimbOn = True ; Turn off lat/lon lines
res@mpGridLatSpacingF = 5.0
res@mpGridLonSpacingF = 5.0
res@mpGridLineColor = "gray"
res@mpGridLineDashPattern = 11
res@pmTickMarkDisplayMode = "Always" ; Turn on map tickmarks
res = set_mp_wrf_map_resources(d2,res)
res@mpLimitMode = "Corners" ; Portion of map to zoom
res@mpLeftCornerLatF = lat2(0,0)
res@mpLeftCornerLonF = lon2(0,0)
res@mpRightCornerLatF = lat2(ny2,nx2)
res@mpRightCornerLonF = lon2(ny2,nx2)
res@tmXTLabelFontHeightF = 0.012
res@tmXBLabelFontHeightF = 0.012
res@tmYLLabelFontHeightF = 0.012
res@tmXTLabelFontHeightF = 0.012
; Add label bar resources
res@lbLabelAutoStride = True
res@gsnMaximize = True ; Maximize plot in frame
res@pmLabelBarOrthogonalPosF = -0.01
res@pmLabelBarHeightF = 0.08
res@lbLabelFontHeightF = 0.01
res@lbTitleOn = True
res@lbTitlePosition = "top"
res@lbTitleString = "Elevation (m)"
res@lbTitleFontHeightF = 0.01
res@lbTopMarginF = 0.17
res@lbTitleOffsetF = 0.01
; we need these to later draw boxes for the location of the nest domain
lnres = True
lnres@gsLineThicknessF = 3.0
lnres@gsLineColor="black"
; make images
map = gsn_csm_contour_map(wks, terr, res)
; pt_a = wrf_user_ll_to_ij(d2,-125.0,41.0,True)
; pt_b = wrf_user_ll_to_ij(d2,-121.5,35.0,True)
lonpts=(/ -125.0, 41.0 /)
latpts=(/ -121.5, 35.0 /)
dum=new(1,graphic) ;must create dummy
dum(0)=gsn_add_polyline(wks,map,lonpts,latpts,lnres)
draw(map)
frame(wks)
end
On Thu, Dec 12, 2013 at 6:51 AM, Mary Haley <haley@ucar.edu> wrote:
> Your message was forwarded to me offline. In the future, please post
> follow-up questions back to ncl-talk.
>
> If your line is still not showing up, this is either because you have
> lat/lon values that fall outside the range of the plot you are trying to
> draw it on, or else you are swapping the lat/lon arrays in the
> gsn_add_polyline call. Make sure "lon" is the first array, and "lat" is
> the second:
>
> >> dum(0)=gsn_add_polyline(wks,map,lonpts,latpts,lnres)
>
>
>
> The "map" plot will draw the lines you've added, if you have added them
> correctly and if they are in the same lat/lon data space as your map.
>
> If you continue to have problems, please email ncl-talk again with the
> following, if possible:
>
> Your NCL script
> A graphic showing the map you are trying to add the lines to.
>
> Thanks,
>
> --Mary
>
>
>
>
>
> > -------- Original Message --------
> > Subject: Re: Simplest way to plot a line
> > Date: Wed, 11 Dec 2013 16:36:02 -0800
> > From: A.J. Eiserloh <arthur.eiserloh@gmail.com>
> > To: Dennis Shea <shea@ucar.edu>
> >
> > Ok, I tried just using lat and lon points directly like example 14, but
> > still no line shows up.
> >
> > I changed it to what you suggested I want.
> >
> >
> > On Wed, Dec 11, 2013 at 4:28 PM, Dennis Shea <shea@ucar.edu> wrote:
> >
> >> Why are you using 'wrf_user_ll_to_ij' ?
> >>
> >> Finds the nearest model grid indices (i,j) to the specified location(s)
> in
> >> longitude and latitude.
> >>
> >> The following is giving model grid index values.
> >> gsn_add_polyline( has no idea how these relate to the real world.
> >>
> >>
> >> > pt_a = wrf_user_ll_to_ij(d2,-126.0,42.0,True)
> >> > pt_b = wrf_user_ll_to_ij(d2,-121.5,34.9,True)
> >> >
> >> > xpts=(/ pt_a(0), pt_b(0) /)
> >> > ypts=(/ pt_a(1), pt_b(1) /)
> >> >
> >> > dum=new(1,graphic) ;must create dummy
> >> > dum(0)=gsn_add_polyline(wks,map,xpts,ypts,lnres)
> >>
> >> The Polylines examples use lat and lon
> >>
> >> Example 4
> >> ypts = (/ 30.0, 30.0, 0.0, 0.0, 30.0/) ; latitudes
> >> xpts = (/-90.0, -45.0,-45.0, -90.0,-90.0/) ; longitudes
> >>
> >> Example 14
> >> dum1 = gsn_add_polyline(wks,plot1, (/lon1, lon2/) , (/lat1, lat2/)
> ,pres)
> >>
> >>
> >> You want:
> >>
> >> lonpts = (/-126.0, -121.5/)
> >> latpts = (/ 42.0, 34.9/)
> >>
> >> dum(0)=gsn_add_polyline(wks,map,lonpts,latpts,lnres)
> >>
> >>
> >>
> >> On 12/11/13, 5:14 PM, A.J. Eiserloh wrote:
> >>
> >>> I tried to use gsn_add_polyline but I only see my map and not the
> line? It
> >>> gives me no errors. Here is my code below:
> >>>
> >>>
> >>>
> >>> load "$NCARG_ROOT/lib/ncarg/nclscripts/csm/gsn_code.ncl"
> >>> load "$NCARG_ROOT/lib/ncarg/nclscripts/csm/gsn_csm.ncl"
> >>> load "$NCARG_ROOT/lib/ncarg/nclscripts/wrf/WRFUserARW.ncl"
> >>> ;load "./WRFUserARW.ncl"
> >>>
> >>> begin
> >>>
> >>> type="png"
> >>> wks = gsn_open_wks(type, "cx_line1") ; Open graphics file
> >>>
> >>> d2 = addfile("/data2/eiserloh/data/AR/run3.1/wrfout_d02_2012-11-
> >>> 28_00:00:
> >>> 00.nc", "r")
> >>>
> >>> terr = wrf_user_getvar(d2,"HGT_M",0)
> >>> lat2 = wrf_user_getvar(d2,"XLAT",0)
> >>> lon2 = wrf_user_getvar(d2,"XLONG",0)
> >>>
> >>> terr@lat2d = lat2
> >>> terr@lon2d = lon2
> >>>
> >>> dom_dims = dimsizes(terr)
> >>> nx2 = dom_dims(1) - 1
> >>> ny2 = dom_dims(0) - 1
> >>>
> >>>
> >>> res = True
> >>>
> >>> ; Set some contouring resources.
> >>> res@cnFillOn = True
> >>> res@cnLinesOn = False
> >>> res@cnLineLabelsOn = False
> >>> res@cnInfoLabelOn = False
> >>> res@gsnSpreadColors = True
> >>> res@cnLevelSelectionMode = "ExplicitLevels"
> >>> res@cnLevels = (/0, 10, 25, 50, 75, 125, 200, 350, 500,
> >>> 750, \
> >>> 1000, 1250, 1500, 1750, 2000, 2250,
> >>> 3000/)
> >>> res@gsnLeftString = ""
> >>> res@gsnRightString = ""
> >>>
> >>> res@gsnDraw = False
> >>> res@gsnFrame = False
> >>>
> >>> ; Add map resources
> >>> res@mpDataBaseVersion = "MediumRes" ; Default is LowRes
> >>> res@mpOutlineDrawOrder = "PostDraw" ; Draw map outlines
> >>> last
> >>> res@mpGridAndLimbOn = True ; Turn off lat/lon
> >>> lines
> >>> res@mpGridLatSpacingF = 5.0
> >>> res@mpGridLonSpacingF = 5.0
> >>> res@mpGridLineColor = "gray"
> >>> res@mpGridLineDashPattern = 11
> >>> res@pmTickMarkDisplayMode = "Always" ; Turn on map
> >>> tickmarks
> >>> res = set_mp_wrf_map_resources(d2,res)
> >>> res@mpLimitMode = "Corners" ; Portion of map to
> >>> zoom
> >>> res@mpLeftCornerLatF = lat2(0,0)
> >>> res@mpLeftCornerLonF = lon2(0,0)
> >>> res@mpRightCornerLatF = lat2(ny2,nx2)
> >>> res@mpRightCornerLonF = lon2(ny2,nx2)
> >>>
> >>> res@tmXTLabelFontHeightF = 0.012
> >>> res@tmXBLabelFontHeightF = 0.012
> >>> res@tmYLLabelFontHeightF = 0.012
> >>> res@tmXTLabelFontHeightF = 0.012
> >>>
> >>> ; Add label bar resources
> >>> res@lbLabelAutoStride = True
> >>> res@gsnMaximize = True ; Maximize plot in frame
> >>> res@pmLabelBarOrthogonalPosF = -0.01
> >>> res@pmLabelBarHeightF = 0.08
> >>> res@lbLabelFontHeightF = 0.01
> >>> res@lbTitleOn = True
> >>> res@lbTitlePosition = "top"
> >>> res@lbTitleString = "Elevation (m)"
> >>> res@lbTitleFontHeightF = 0.01
> >>> res@lbTopMarginF = 0.17
> >>> res@lbTitleOffsetF = 0.01
> >>>
> >>> ; we need these to later draw boxes for the location of the nest domain
> >>> lnres = True
> >>> lnres@gsLineThicknessF = 3.0
> >>> lnres@gsLineColor="black"
> >>>
> >>> ; make images
> >>> map = gsn_csm_contour_map(wks, terr, res)
> >>>
> >>> ;get point A and B
> >>>
> >>> pt_a = wrf_user_ll_to_ij(d2,-126.0,42.0,True)
> >>> pt_b = wrf_user_ll_to_ij(d2,-121.5,34.9,True)
> >>>
> >>> xpts=(/ pt_a(0), pt_b(0) /)
> >>> ypts=(/ pt_a(1), pt_b(1) /)
> >>>
> >>> dum=new(1,graphic) ;must create dummy
> >>> dum(0)=gsn_add_polyline(wks,map,xpts,ypts,lnres)
> >>>
> >>> draw(map)
> >>> frame(wks)
> >>>
> >>> end
> >>>
> >>>
> >>>
> >>> On Wed, Dec 11, 2013 at 3:55 PM, Dennis Shea <shea@ucar.edu> wrote:
> >>>
> >>> Please look at examples.
> >>>>
> >>>> http://www.ncl.ucar.edu/Applications/
> >>>>
> >>>> Search/Look for something with "lines" ==> Polylines
> >>>>
> >>>> Click
> >>>>
> >>>> http://www.ncl.ucar.edu/Applications/polyg.shtml
> >>>> Example 4
> >>>> Example 14
> >>>>
> >>>>
> >>>>
> >>>>
> >>>>
> >>>> On 12/11/13, 4:42 PM, A.J. Eiserloh wrote:
> >>>>
> >>>> What is the easiest way to plot a line onto a gsn_csm_contour_map() ?
> I
> >>>>> have 2 points and I would like to just draw a line through those
> points.
> >>>>>
> >>>>>
> >>>>>
> >>>>>
> >>>>> _______________________________________________
> >>>>> ncl-talk mailing list
> >>>>> List instructions, subscriber options, unsubscribe:
> >>>>> http://mailman.ucar.edu/mailman/listinfo/ncl-talk
> >>>>>
> >>>>>
> >>>>>
> >>>
> >>>
> >
> >
> > --
> > Arthur J. Eiserloh, Jr.
> > San Jose State University
> > Graduate Student
> > Dept. of Meteorology and Climate Science
> >
> >
> >
>
>
--
Arthur J. Eiserloh, Jr.
San Jose State University
Graduate Student
Dept. of Meteorology and Climate Science