Date: Mon Dec 16 2013 - 14:58:36 MST
Hi all,
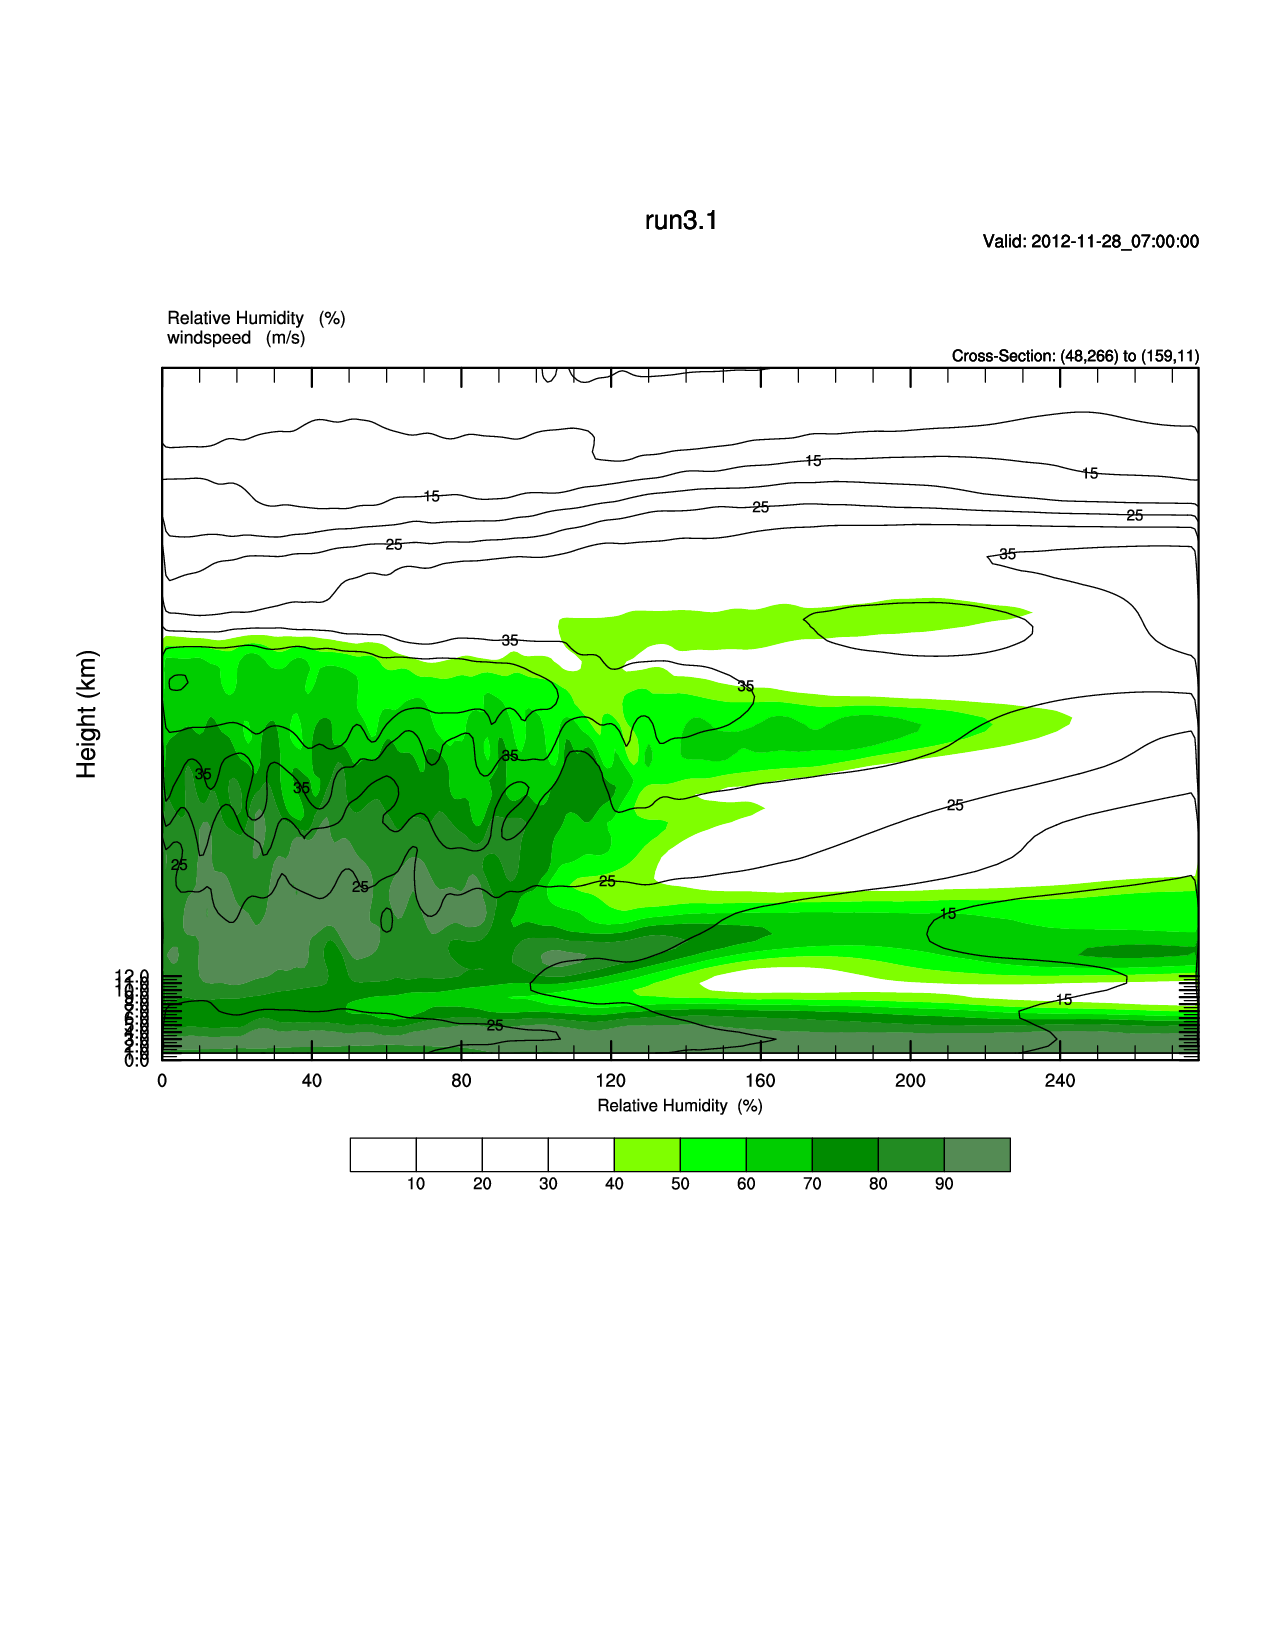
I am trying to create appropriate tick marks for my vertical WRF 2-d
cross-section. The unit for my y-axis is kilometers. There are 100 points
in my vertical dimension in my cross section (dimension 0). When I try to
tell NCL to put my tick marks from 0 km to 12 km, it seems like it is
placing the tick marks at the dimension locations instead of the actual
height data itself. How can I tell NCL to place the tick marks at the
actual data instead of the points? I want my y-limit to be 0-12km.
load "$NCARG_ROOT/lib/ncarg/nclscripts/csm/gsn_code.ncl"
load "$NCARG_ROOT/lib/ncarg/nclscripts/csm/contributed.ncl"
load "$NCARG_ROOT/lib/ncarg/nclscripts/wrf/WRFUserARW.ncl"
load "$NCARG_ROOT/lib/ncarg/nclscripts/wrf/WRF_contributed.ncl"
begin
case ="run3.1"
cmd ="ls -1 /data2/eiserloh/data/AR/" + case + "/wrfout_d02_2012*" ;frost
files = systemfunc(cmd) + ".nc"
a = addfiles(files,"r")
times = wrf_user_list_times(a) ; get times in the files
ntimes = dimsizes(times)
pt_a= wrf_user_ll_to_ij(a[0],-126.0,42.0,True)
print(pt_a)
pt_b= wrf_user_ll_to_ij(a[0],-121.8,35.0,True)
print(pt_b)
plane = new(4,float)
plane=(/ pt_a(0),pt_b(0),pt_a(1),pt_b(1) /)
type = "ps"
FirstTime=True
do it=0,1
;do it=0,ntimes-1
print("Working on time: " + times(it))
if (it.lt.10) then
wks = gsn_open_wks(type,"cxsect_line1"+"_00"+tostring(it))
end if
if ((it.ge.10).and.(it.lt.100)) then
wks = gsn_open_wks(type,"cxsect_line1"+"_0"+tostring(it))
end if
if (it.ge.100) then
wks = gsn_open_wks(type,"cxsect_line1"+"_"+tostring(it))
end if
; Extract cross section from point A to point B, as defined in "plane"
; And vertically interpolate to either height or p coordinates
z = wrf_user_getvar(a[it],"z",0)
z=z/1000. ;convert to km
rh = wrf_user_getvar(a[it],"rh",0)
u = wrf_user_getvar(a[it],"ua",0)
v = wrf_user_getvar(a[it],"va",0)
ws = ((u^2)+(v^2))^(0.5)
ws@description = "windspeed"
ws@units = "m/s"
rh_plane = wrf_user_intrp3d(rh,z,"v",plane,0.,True) ;True if cross sect
from ptA to ptB
rh_plane = smth9_Wrap(rh_plane,0.5,0.2,True)
printVarSummary(rh_plane)
ws_plane = wrf_user_intrp3d(ws,z,"v",plane,0.,True) ;windspeed plane
ws_plane = smth9_Wrap(ws_plane,0.5,0.2,True)
ws_plane = smth9_Wrap(ws_plane,0.5,0.2,True)
res = True
res@gsnDraw = False
res@gsnFrame= False
; Options for XY Plots
opts_xy = res
opts_xy@tiYAxisString = "Height (km)"
opts_xy@cnMissingValPerimOn = True
opts_xy@cnMissingValFillColor = 0
opts_xy@cnMissingValFillPattern = 11
opts_xy@tmYLMode = "Explicit"
opts_xy@tmYLValues = fspan(0.0,12.0,13)
; Create tick marks
opts_xy@tmYLMinorValues = fspan(0.5,11.5,12)
opts_xy@tmYLLabels =
sprintf("%.1f",fspan(0.0,12.0,13)) ; Create labels
opts_xy@tiXAxisFontHeightF = 0.015
opts_xy@tiYAxisFontHeightF = 0.015
opts_xy@tmXBMajorOutwardLengthF = 0.0
opts_xy@tmYLMajorLengthF = 0.012
opts_xy@tmYLLabelFontHeightF = 0.011
opts_xy@tmXBLabelFontHeightF = 0.011
opts_xy@PlotOrientation = ws_plane@Orientation
opts_xy@Footer = False
opts_xy@MainTitle = tostring(case)
opts_xy@MainTitlePos = "Center"
opts_xy@InitTime = False
opts_xy@ValidTime = True
opts_xy@TimeLabel = times(it)
; Plotting options for RH
opts_rh = opts_xy
opts_rh@ContourParameters = (/ 10., 90., 10. /)
opts_rh@pmLabelBarOrthogonalPosF = -0.185
opts_rh@lbLabelOffsetF = 0.02 ;determines amount of
space between actual label and labelbar
opts_rh@lbBoxMinorExtentF = 0.12 ; perpendicular width of
labelbar
opts_rh@lbLabelFontHeightF = 0.01
opts_rh@lbTitleFontHeightF = 0.01
opts_rh@cnFillOn = True
opts_rh@cnFillColors = (/"White","White","White", \
"White","Chartreuse","Green", \
"Green3","Green4", \
"ForestGreen","PaleGreen4"/)
; Plotting options for windspeed
opts_ws = opts_xy
opts_ws@ContourParameters =(/5.0,100.0,5.0/)
opts_ws@cnFillOn = False
opts_ws@cnLineLabelBackgroundColor = -1
opts_ws@cnInfoLabelOn = False
opts_ws@cnLineLabelPerimOn = False
opts_ws@cnLineLabelDensityF = -3.0
opts_ws@cnLineLabelFontHeightF = 0.009
; opts_ws@cnSmoothingOn = True
; opts_ws@cnSmoothingTensionF = 0.02
;Get the contour info for the rh and temp
contour_ws = wrf_contour(a[it],wks,ws_plane,opts_ws)
contour_rh = wrf_contour(a[it],wks,rh_plane,opts_rh)
; MAKE PLOTS
pltres = True
pltres@Footer = False
plot = wrf_overlays(a[it],wks,(/contour_rh,contour_ws/),pltres)
delete(wks)
end do
end
--
Arthur J. Eiserloh, Jr.
San Jose State University
Graduate Student
Dept. of Meteorology and Climate Science
_______________________________________________
ncl-talk mailing list
List instructions, subscriber options, unsubscribe:
http://mailman.ucar.edu/mailman/listinfo/ncl-talk