Date: Wed Jan 27 2010 - 11:31:36 MST
Hi Wee-Beng,
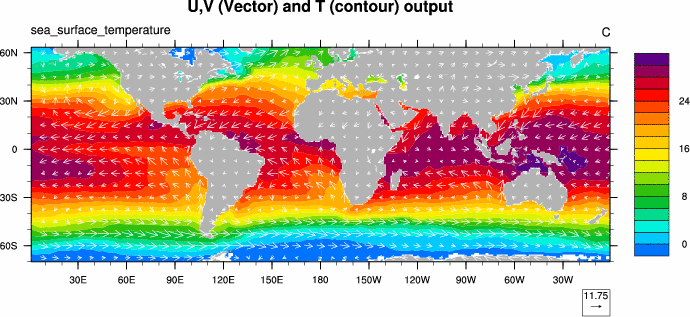
I ran your script, and my result looks fine. (See attached .jpg.) I used
HadISST for sst's, and the NCEP/NCAR Reanalysis for near surface winds.
My graphical output type was a .ps file, and there wasn't a difference
if I output to x11. I didn't touch any of your graphical resources.
(See attached script.)
I would also highly recommend you download and install the .hluresfule
as is described here: http://www.ncl.ucar.edu/Document/Graphics/hlures.shtml
This changes, amongst other things, your default font type to helvetica...
Adam
On 01/27/2010 03:57 AM, Wee-Beng Tay wrote:
> Hi,
>
> I have a vector + contour plot. I noticed that there are strange lines
> (black circle) appearing in my output. I wonder how I got them. There is
> no such problem if I only draw a vector plot. Can someone enlighten?
>
> I have attached my ncl file as well as the jpg of the output.
>
> Thanks alot!
>
> Wee-Beng Tay
>
>
>
> _______________________________________________
> ncl-talk mailing list
> List instructions, subscriber options, unsubscribe:
> http://mailman.ucar.edu/mailman/listinfo/ncl-talk
--
__________________________________________________
Adam Phillips
asphilli@ucar.edu
National Center for Atmospheric Research   tel: (303) 497-1726
Climate and Global Dynamics Division         fax: (303) 497-1333
P.O. Box 3000
Boulder, CO 80307-3000    http://www.cgd.ucar.edu/cas/asphilli
_______________________________________________
ncl-talk mailing list
List instructions, subscriber options, unsubscribe:
http://mailman.ucar.edu/mailman/listinfo/ncl-talk
- text/plain attachment: vector_contour_opt_TIMCOM1.ncl
