Hi Adam,
Thanks a lot for your answer. It works fine, though I am still waiting an answer for the question 1.
Best regards,
Mark
________________________________
From: "ncl-talk-request_at_ucar.edu" <ncl-talk-request_at_ucar.edu>
To: ncl-talk_at_ucar.edu
Sent: Thursday, September 22, 2011 2:50 AM
Subject: ncl-talk Digest, Vol 94, Issue 55
Send ncl-talk mailing list submissions to
ncl-talk_at_ucar.edu
To subscribe or unsubscribe via the World Wide Web, visit
http://mailman.ucar.edu/mailman/listinfo/ncl-talk
or, via email, send a message with subject or body 'help' to
ncl-talk-request_at_ucar.edu
You can reach the person managing the list at
ncl-talk-owner_at_ucar.edu
When replying, please edit your Subject line so it is more specific
than "Re: Contents of ncl-talk digest..."
Today's Topics:
1. Re: plot station data and adding polygon from shape file
(Adam Phillips)
2. Re: ncl_fnl (Mary Haley)
3. Re: question of install ncl under linux (Mary Haley)
4. Re: emacs ncl-mode is still being maintained.? (Mary Haley)
5. Re: Stil label bar problems (David Brown)
6. Re: Stil label bar problems (Mary Haley)
----------------------------------------------------------------------
Message: 1
Date: Wed, 21 Sep 2011 16:36:12 -0600
From: Adam Phillips <asphilli_at_ucar.edu>
Subject: Re: plot station data and adding polygon from
shape file
To: ncl-talk_at_ucar.edu
Message-ID: <4E7A66DC.8050904_at_ucar.edu>
Content-Type: text/plain; charset=ISO-8859-1; format=flowed
Hi Mark,
I can answer questions 2 and 3.. Someone else will have to chime in for
question #1... answers are below
On 09/21/2011 11:59 AM, Mark Chan wrote:
> Dear NCL users,
>
> The attached files are NCL script and its plot (I didn't attach data
> file since it is too big).
>
> My questions are as:
>
> question 1: How to plot the station data by extrapolation so the plot
> could cover the whole target region?
> question 2: The boundary is another shape file, how to change the
> "boundary line" ( lnres_at_gsLineThicknessF = 2.0), make it different from
> the line inside target region.
Right now you are calling attach_shapefile_polyline to draw your
polylines. You are passing in the file, the workstation, the plot, and
the line_color. I would pass through a 5th array, a generic attribute
array (more complicated), or simply a float value denoting the line
thickness.
change this:
function attach_shapefile_polyline(f:file,wks,plot,line_color)
to this:
function attach_shapefile_polyline(f:file,wks,plot,line_color,lt)
change this:
lnres_at_gsLineThicknessF = 1.0
to this:
lnres_at_gsLineThicknessF = lt
and these:
map = attach_shapefile_polyline(f2,wks,map,"white")
map = attach_shapefile_polyline(f1,wks,map,"black")
to these:
map = attach_shapefile_polyline(f2,wks,map,"white",1.0)
map = attach_shapefile_polyline(f1,wks,map,"black",2.0)
> question 3: I also want to display the mark points, how to bring the
> mark to the front.
You need to tell NCL to draw the mark points last. You can do that by
altering the draw order:
http://www.ncl.ucar.edu/Applications/draworder.shtml
Specifically, you want to set mkres_at_tfPolyDrawOrder = "PostDraw"
Hope that helps!
Adam
>
> Thanks very much!
> Mark
>
>
>
> _______________________________________________
> ncl-talk mailing list
> List instructions, subscriber options, unsubscribe:
> http://mailman.ucar.edu/mailman/listinfo/ncl-talk
--
______________________________________________________________
Adam Phillips asphilli_at_ucar.edu
NCAR/Climate and Global Dynamics Division (303) 497-1726
P.O. Box 3000
Boulder, CO 80307-3000 http://www.cgd.ucar.edu/cas/asphilli
------------------------------
Message: 2
Date: Wed, 21 Sep 2011 20:02:55 -0400
From: Mary Haley <haley_at_ucar.edu>
Subject: Re: ncl_fnl
To: cnl88 <cnl88_at_163.com>
Cc: ncl-talk_at_ucar.edu
Message-ID: <E6D77491-937C-4BE3-834D-6BAA00A5114E_at_ucar.edu>
Content-Type: text/plain; charset="utf-8"
You have the following resource set, which might be thinning your vectors quite a bit:
res_at_vcMinDistanceF = 0.025 ; thin out windbarbs
You actually have this resource set twice, so try commenting out both settings and see if you get more vectors.
--Mary
On Sep 21, 2011, at 5:16 AM, cnl88 wrote:
>
> <??1.png>
>
> I used the data of fnl to draw the wind of east asia. but I change the fanction
> from plot=gsn_csm_vector_map(wks,u,v,res) to
> plot=gsn_csm_vector_map(wks,u(::2,::2),v(::2,::2),res) or
> from plot=gsn_csm_vector_map(wks,u(::3,::3),v(::3,::3),res) to
> plot=gsn_csm_vector_map(wks,u(::5,::5),v(::5,::5),res) the results were the same !Ido not know why .i want to increase the density of the wind .how should i do ??
>
>
> <fnl_201104new2.ncl>_______________________________________________
> ncl-talk mailing list
> List instructions, subscriber options, unsubscribe:
> http://mailman.ucar.edu/mailman/listinfo/ncl-talk
-------------- next part --------------
An HTML attachment was scrubbed...
URL: http://mailman.ucar.edu/pipermail/ncl-talk/attachments/20110921/ee6798e2/attachment.html
------------------------------
Message: 3
Date: Wed, 21 Sep 2011 20:04:28 -0400
From: Mary Haley <haley_at_ucar.edu>
Subject: Re: question of install ncl under linux
To: ??? <niugt04_at_126.com>
Cc: "ncl-talk_at_ucar.edu" <ncl-talk_at_ucar.edu>
Message-ID: <73EC9C98-31A2-4855-95DE-236426FD27BC_at_ucar.edu>
Content-Type: text/plain; charset="utf-8"
It lokos like you don't have NCARG_ROOT set.
Plese see:
http://www.ncl.ucar.edu/Download/install.shtml#SetNCARG_ROOT
--Mary
On Sep 21, 2011, at 11:42 AM, ??? wrote:
> when I run ncl,it gives warning as:
>
> name_at_a4700:~> ncl. G7 X/ x- I# G0 \- U: H! B
> Copyright (C) 1995-2009 - All Rights Reserved
> University Corporation for Atmospheric Research
> NCAR Command Language Version 5.1.1
> The use of this software is governed by a License Agreement.
> See http://www.ncl.ucar.edu/ for more details.
> /lib/ncarg/sysresfiled System Resource File /home/name/ncl
> warning:WorkstationClassInitialize:Unable to access rgb color database - named colors unsupported:[errno=2]
> /lib/ncarg/colormaps:1533]:NhlLoadColormapFiles: Invalid colormap directory: /home/name/ncl
> ncl 0>
> 2011-09-21
> ???
> _______________________________________________
> ncl-talk mailing list
> List instructions, subscriber options, unsubscribe:
> http://mailman.ucar.edu/mailman/listinfo/ncl-talk
-------------- next part --------------
An HTML attachment was scrubbed...
URL: http://mailman.ucar.edu/pipermail/ncl-talk/attachments/20110921/7e891fa3/attachment.html
------------------------------
Message: 4
Date: Wed, 21 Sep 2011 20:26:21 -0400
From: Mary Haley <haley_at_ucar.edu>
Subject: Re: [ncl-talk] emacs ncl-mode is still being maintained.?
To: yagnesh <yagnesh_at_lowtem.hokudai.ac.jp>
Cc: ncl-talk <ncl-talk_at_ucar.edu>
Message-ID: <1D9DA6BA-01E6-4C45-BE01-3EB24F107EEC_at_ucar.edu>
Content-Type: text/plain; charset="us-ascii"
Please see the updated version at:
http://www.ncl.ucar.edu/Applications/Files/ncl.el
--Mary
On Sep 20, 2011, at 7:22 PM, yagnesh wrote:
> On 09/21/2011 01:27 AM, Mary Haley wrote:
>
> Hello Mary.,
>
> Thanks for the reply.,
>
> > I use ncl.el all the time, so I
> should update it myself. I'll do that shortly and put a new
> version out. I'll even put a new date on it. :-)
>
> >
>
> > --Mary
>
> >
>
> Thank you and looking forward to see the new version of ncl.el.
>
> By the Way.. I tried to make a dictionary consisting of all the keywords of
> ncl to make use of auto-completion system.
>
> I parsed these two pages (functions & resources)
>
> http://www.ncl.ucar.edu/Document/Functions/list_alpha.shtml
> http://www.ncl.ucar.edu/Document/Graphics/Resources/list_alpha_res.shtml
>
> and collected the keywords.,
>
> my question is, this makes a full list.? or am I missing any other
> keywords.?
>
> --
> Yagnesh
> Hokkaido University.
>
-------------- next part --------------
An HTML attachment was scrubbed...
URL: http://mailman.ucar.edu/pipermail/ncl-talk/attachments/20110921/8a0eaed2/attachment.html
------------------------------
Message: 5
Date: Wed, 21 Sep 2011 18:45:22 -0600
From: David Brown <dbrown_at_ucar.edu>
Subject: Re: Stil label bar problems
To: ugo merlini <ugomerlini_at_hotmail.com>
Cc: ncl-talk_at_ucar.edu
Message-ID: <8B08163F-22D1-40CD-B27B-0DC549AFB50C_at_ucar.edu>
Content-Type: text/plain; charset="us-ascii"
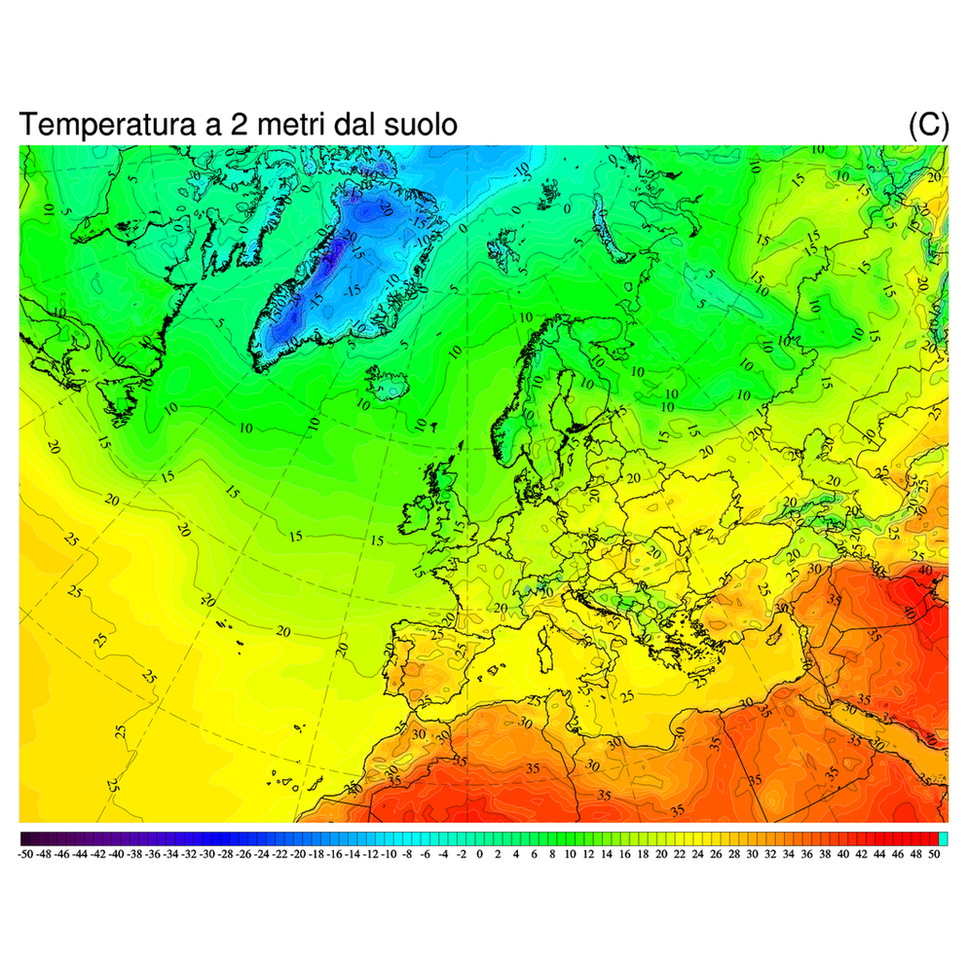
You have 101 levels (-50 -- +50 w/ step size 1) and cnFillColors is set with 101 colors. If you read the documentation for cnFillColors you will see that it needs to have one more color than there are levels. That is so values both below the minimum level and above the maximum level can be assigned a color. I think you simply need to add one more color index value to cnFillColors.
-dave
On Sep 21, 2011, at 4:23 PM, ugo merlini wrote:
> Hi
>
> I still have label bar problem as can be seen on picture below at the end of the label bar there is a light blue box which in teory is not part of the labal bar
>
> How delete it?
>
> ugo
>
>
> http://i103.photobucket.com/albums/m136/ugo73/temperatura02_2011092123.png
>
>
>
>
>
>
>
> ;----------------------------------------------------------------------
> ; This example shows how to read geographic data
> ; from Natural Earth shapefiles
> ; and plot them as polylines and polygons.
> ;----------------------------------------------------------------------
> ; This particular example plots data for Switzerland.
> ;----------------------------------------------------------------------
> ; Download the shapefiles from http://www.naturalearthdata.com/
> ; Unzip to a directory
> ;----------------------------------------------------------------------
>
> load "$NCARG_ROOT/lib/ncarg/nclscripts/csm/gsn_code.ncl"
> load "$NCARG_ROOT/lib/ncarg/nclscripts/csm/gsn_csm.ncl"
> load "$NCARG_ROOT/lib/ncarg/nclscripts/csm/contributed.ncl"
> load "$NCARG_ROOT/lib/ncarg/nclscripts/csm/shea_util.ncl"
>
> begin
>
> ;*****************************************
> ; Open workstation and define colormap *
> ;*****************************************
>
> wks_type = "png" ; use "newpdf" instead of "pdf" for smaller files
> wks_type_at_wkWidth = 1600
> wks_type_at_wkHeight = 1600
> wks = gsn_open_wks(wks_type,"temp")
> gsn_define_colormap(wks,"rainbow+white+gray") ; choose colormap
>
> ;*****************
> ; Generare map *
> ;*****************
> ;--- resouces for map
> res = True ; plot mods desired
> res_at_mpProjection = "LambertConformal" ; choose projection
>
> res = True ; plot mods desired
>
> res_at_gsnMaximize = True
> res_at_gsnDraw = False ; do not draw the plot
> res_at_gsnFrame = False ; do not flip the page
>
> res_at_mpProjection = "LambertConformal" ; choose projection
> res_at_mpLimitMode = "LatLon"
> res_at_mpMaxLonF = 47.0
> res_at_mpMaxLatF = 88.5
> res_at_mpMinLatF = 27.0
> res_at_mpMinLonF = -43.0
> res_at_mpGridAndLimbOn = True ; turn on grid lines
> res_at_mpGridLineDashPattern = 10 ; lat/lon lines dashed
>
>
> drawNDCGrid(wks)
>
> map = gsn_csm_map(wks,res)
>
> ;--- create map from shapefiles
>
> fnames = "/mnt/internetserver/map/shapefile/europa/aaa_full/" + (/"europa"/) + ".shp" ; Files to be open
> linecolors = (/"Black"/) ; color definition for each shapefile
> fillcolors = (/"Transparent"/) ; Fill color definition for each shapefile
> thicks = (/2/) ; Thickness for each shapefile
> lnres = True ; resources for polylines
> plres = True
> prims = True
> lines = True
> do n=0,dimsizes(fnames)-1 ; Loop through files that we want to read geographic information from.
> f = addfile(fnames(n),"r") ; Open the shapefile number n.
> segments = f->segments ; Read data off the shapefile
> geometry = f->geometry
> segsDims = dimsizes(segments)
> geomDims = dimsizes(geometry)
> geom_segIndex = f_at_geom_segIndex ; Read global attributes
> geom_numSegs = f_at_geom_numSegs
> segs_xyzIndex = f_at_segs_xyzIndex
> segs_numPnts = f_at_segs_numPnts
> geometry_type = f_at_geometry_type
> numFeatures = geomDims(0)
> lon = f->x
> lat = f->y
> if (geometry_type.eq."polygon") then ; Put if statement outside the loop
> plres_at_gsFillColor = fillcolors(n)
> plres_at_gsEdgesOn = True ; Draw border around polygons
> plres_at_gsEdgeColor = linecolors(n)
> plres_at_gsEdgeThicknessF = thicks(n)
> do i=0, numFeatures-1 ; Section to draw polygons on map.
> startSegment = geometry(i, geom_segIndex)
> numSegments = geometry(i, geom_numSegs)
> do seg=startSegment, startSegment+numSegments-1
> startPT = segments(seg, segs_xyzIndex)
> endPT = startPT + segments(seg, segs_numPnts) - 1
> dumstr = unique_string("lines") ; This call adds the polygon.
> map@$dumstr$ = gsn_add_polygon(wks, map , lon(startPT:endPT), lat(startPT:endPT), plres)
> end do
> end do
> else
> lnres_at_gsLineThicknessF = thicks(n)
> lnres_at_gsLineColor = linecolors(n)
> do i=0, numFeatures-1 ; Section to draw polylines on map.
> startSegment = geometry(i, geom_segIndex)
> numSegments = geometry(i, geom_numSegs)
> do seg=startSegment, startSegment+numSegments-1
> startPT = segments(seg, segs_xyzIndex)
> endPT = startPT + segments(seg, segs_numPnts) - 1
> dumstr = unique_string("primitive") ; This call adds the line segment.
> map@$dumstr$ = gsn_add_polyline(wks, map, lon(startPT:endPT), lat(startPT:endPT), lnres)
> end do
> end do
> end if
> delete(lat) ; Clean up before we read in same variables again.
> delete(lon)
> delete(segments)
> delete(geometry)
> delete(segsDims)
> delete(geomDims)
> end do
>
> ;******************
> ; read gfs data *
> ;******************
>
> url = "http://nomad1.ncep.noaa.gov:9090/dods/gfs_master/gfs" + systemfunc("date +%Y%m%d") + "/"
> systemdate = systemfunc("date +%H")
>
> if ((systemdate.ge.06).and.(systemdate.lt.12)) then
> filename = url + "gfs_master_00z"
> end if
> if ((systemdate.ge.12).and.(systemdate.lt.18)) then
> filename = url + "gfs_master_06z"
> end if
> if ((systemdate.ge.18).and.(systemdate.lt.24)) then
> filename = url + "gfs_master_06z"
> end if
> if ((systemdate.ge.06).and.(systemdate.lt.06)) then
> filename = url + "gfs_master_18z"
> end if
> filename = "http://nomad1.ncep.noaa.gov:9090/dods/gfs_master/gfs20110916/gfs_master_18z"
> exists = isfilepresent(filename)
> if(.not.exists) then
> print("OPeNDAP isfilepresent test unsuccessful.")
> print("Either file doesn't exist, or NCL does not have OPeNDAP capabilities on this system")
> else
> print("OPeNDAP isfilepresent test successful.")
> gfs = addfile(filename,"r")
> vars = getfilevarnames(gfs)
> end if
>
> ;*******************************
> ; 2 metres temperature plot *
> ;*******************************
> ;--- resouces for 2 metres temperature plot
> res1= True
>
> res1_at_gsnMaximize = True
> res1_at_gsnDraw = False ; do not draw the plot
> res1_at_gsnFrame = False ; do not flip the page
> res1_at_gsnAddCyclic = True
> res1_at_gsnSpreadColors = False ; turn off the use entire color map
> res1_at_gsnContourNegLineDashPattern = 10
>
>
>
>
>
>
> res1_at_cnLineDashSegLenF = 0.04
>
> res1_at_cnLinesOn = True ; turn on contour lines
> res1_at_cnLineLabelsOn = True ; turn on contour labels
> res1_at_cnLineLabelFont = "times-roman" ; set font on contour labels
> res1_at_cnLineLabelFontHeightF = 0.006 ; set font height on contour labels
> res1_at_cnLineLabelPlacementMode = "Constant" ; set placement mode of labels on contour
> res1_at_cnLineLabelBackgroundColor = "Transparent" ; set background color of the contour label
>
> res1_at_cnLevelSelectionMode = "ManualLevels" ; set how manage contour line levels
> res1_at_cnMinLevelValF = -50 ; max level do draw contour lines
> res1_at_cnMaxLevelValF = 50 ; min level do draw contour lines
> res1_at_cnLevelSpacingF = 1 ; set spacing between contour lines
> res1_at_cnLevelFlags = (/"LineAndLabel","LineOnly","LineOnly","LineOnly","LineOnly","LineAndLabel","LineOnly","LineOnly","LineOnly","LineOnly", \
> "LineAndLabel","LineOnly","LineOnly","LineOnly","LineOnly","LineAndLabel","LineOnly","LineOnly","LineOnly","LineOnly", \
> "LineAndLabel","LineOnly","LineOnly","LineOnly","LineOnly","LineAndLabel","LineOnly","LineOnly","LineOnly","LineOnly", \
> "LineAndLabel","LineOnly","LineOnly","LineOnly","LineOnly","LineAndLabel","LineOnly","LineOnly","LineOnly","LineOnly", \
> "LineAndLabel","LineOnly","LineOnly","LineOnly","LineOnly","LineAndLabel","LineOnly","LineOnly","LineOnly","LineOnly", \
> "LineAndLabel","LineOnly","LineOnly","LineOnly","LineOnly","LineAndLabel","LineOnly","LineOnly","LineOnly","LineOnly", \
> "LineAndLabel","LineOnly","LineOnly","LineOnly","LineOnly","LineAndLabel","LineOnly","LineOnly","LineOnly","LineOnly", \
> "LineAndLabel","LineOnly","LineOnly","LineOnly","LineOnly","LineAndLabel","LineOnly","LineOnly","LineOnly","LineOnly", \
> "LineAndLabel","LineOnly","LineOnly","LineOnly","LineOnly","LineAndLabel","LineOnly","LineOnly","LineOnly","LineOnly", \
> "LineAndLabel","LineOnly","LineOnly","LineOnly","LineOnly","LineAndLabel","LineOnly","LineOnly","LineOnly","LineOnly", \
> "LineAndLabel"/) ; set how draw contour lines
> res1_at_cnFillColors = (/12,14,16,18,20,22,24,26,28,30,32,34,36,38,40,42,44,46,48,50,52,54,56,58,60,62,64,66,68,70,72,74,76,78,80,82,84,86,88,90,92,94,96,98,100,102,104,106,108,110,112,114,116,118,120,122,124,128,132,136,140,144,148,152,156,160,164,166,168,170,172,174,176,178,180,182,184,186,188,190,192,194,196,198,200,202,204,206,208,210,212,214,216,218,220,222,224,226,228,230,232/)
> res1_at_cnMonoLineColor = False ; turn off auto contour line colors
> res1_at_cnLineColors = (/"Black","White","White","White","White","Black","White","White","White","White", \
> "Black","White","White","White","White","Black","White","White","White","White", \
> "Black","White","White","White","White","Black","White","White","White","White", \
> "Black","White","White","White","White","Black","White","White","White","White", \
> "Black","White","White","White","White","Black","White","White","White","White", \
> "Black","White","White","White","White","Black","White","White","White","White", \
> "Black","White","White","White","White","Black","White","White","White","White", \
> "Black","White","White","White","White","Black","White","White","White","White", \
> "Black","White","White","White","White","Black","White","White","White","White", \
> "Black","White","White","white","White","Black","White","White","White","White", \
> "Black"/) ; set contour lines colors
> res1_at_cnMonoLineThickness = False ; turn off auto contour line thickness
> res1_at_cnLineThicknesses = (/1.0,0.5,0.5,0.5,0.5,1.0,0.5,0.5,0.5,0.5, \
> 1.0,0.5,0.5,0.5,0.5,1.0,0.5,0.5,0.5,0.5, \
> 1.0,0.5,0.5,0.5,0.5,1.0,0.5,0.5,0.5,0.5, \
> 1.0,0.5,0.5,0.5,0.5,1.0,0.5,0.5,0.5,0.5, \
> 1.0,0.5,0.5,0.5,0.5,1.0,0.5,0.5,0.5,0.5, \
> 1.0,0.5,0.5,0.5,0.5,1.0,0.5,0.5,0.5,0.5, \
> 1.0,0.5,0.5,0.5,0.5,1.0,0.5,0.5,0.5,0.5, \
> 1.0,0.5,0.5,0.5,0.5,1.0,0.5,0.5,0.5,0.5, \
> 1.0,0.5,0.5,0.5,0.5,1.0,0.5,0.5,0.5,0.5, \
> 1.0,0.5,0.5,0.5,0.5,1.0,0.5,0.5,0.5,0.5, \
> 1.0/) ; set contour lines thickness
>
> res1_at_lbLabelsOn = True ; turn on the labels
> ;res1_at_lbLabelAutoStride = False ; let NCL determine label spacing
> res1_at_lbLeftMarginF = 0.001
> res1_at_lbOrientation = "horizontal" ; label orientation
> res1_at_lbBoxLinesOn = True ; turn on lines between labelbar colors
> res1_at_lbLabelFont= "times-roman" ; font
> res1_at_lbLabelFontHeightF= 0.005 ; set the label size
> res1_at_lbLabelAlignment = "BoxCenters"
> res1_at_pmLabelBarHeightF = 0.04
> res1_at_lbLabelStride = 2 ; label every other box
>
>
> res1_at_cnFillOn = True ; turn on color
>
>
>
>
>
>
> ;---data for 2 metres temperature plot
>
> TEMP2M = gfs->tmp2m(:,:,:) ; temperature
> NTIMES = dimsizes(gfs->time) ; number of times in the file
> TEMP2M = TEMP2M - 273.15
> TEMP2M_at_units = "(C)"
> TEMP2M_at_long_name = "Temperatura a 2 metri dal suolo"
> do it = 0,1 ;NTIMES-1
> plot = gsn_csm_contour(wks,TEMP2M(it,:,:),res1)
> overlay(map,plot)
> draw(map)
> frame(wks)
> end do
> do it = 0,1 ;NTIMES-1
> if (it.le.8) then
> system("mv temp.00000" + (it+1) + ".png" + " temperatura0" + (it) + "_" + systemfunc("date +%Y%m%d%H") + ".png")
> end if
> if (it.eq.9) then
> system("mv temp.0000" + (it+1) + ".png" + " temperatura0" + (it) + "_" + systemfunc("date +%Y%m%d%H") + ".png")
> end if
> if (it.ge.10) then
> system("mv temp.0000" + (it+1) + ".png" + " temperatura" + (it) + "_" + systemfunc("date +%Y%m%d%H") + ".png")
> end if
> end do
> end
>
>
> _______________________________________________
> ncl-talk mailing list
> List instructions, subscriber options, unsubscribe:
> http://mailman.ucar.edu/mailman/listinfo/ncl-talk
-------------- next part --------------
An HTML attachment was scrubbed...
URL: http://mailman.ucar.edu/pipermail/ncl-talk/attachments/20110921/4a56ab92/attachment.html
------------------------------
Message: 6
Date: Wed, 21 Sep 2011 20:50:30 -0400
From: Mary Haley <haley_at_ucar.edu>
Subject: Re: Stil label bar problems
To: ugo merlini <ugomerlini_at_hotmail.com>
Cc: ncl-talk_at_ucar.edu
Message-ID: <50449D11-EB83-4B09-84B9-F13EECA224BC_at_ucar.edu>
Content-Type: text/plain; charset="us-ascii"
This is the same problem you had before, that I sent you a solution for on September 12.
You are not providing enough fill colors for the cnFillColors resource.
When you set the contour levels via:
res1_at_cnMinLevelValF = -50 ; max level do draw contour lines
res1_at_cnMaxLevelValF = 50 ; min level do draw contour lines
res1_at_cnLevelSpacingF = 1 ; set spacing between contour lines
You are effectively generating 101 contour levels. These levels represent the values *between* colors, so by default, you must have one more color in your cnFillColors array than you have contour levels.
You are only providing 101 colors, and hence NCL comes up with the extra one it needs. Add one more color to the setting of the cnFillColors resource, and you should be okay.
However, there may be another issue: you are setting the labelbar label alignment to "center". This means that you now need to come up with one more label, because by default, these labels are supposed to represent the lines between each color, and not each color itself.
You may need to set lbLabelStrings to fix this problem.
Please reread the message I sent you a couple of weeks ago:
http://www.ncl.ucar.edu/Support/talk_archives/2011/2165.html
--Mary
On Sep 21, 2011, at 6:23 PM, ugo merlini wrote:
> ;----------------------------------------------------------------------
> ; Download the shapefiles from http://www.naturalearthdata.com/
> ; Unzip to a directory
> ;----------------------------------------------------------------------
>
> load "$NCARG_ROOT/lib/ncarg/nclscripts/csm/gsn_code.ncl"
> load "$NCARG_ROOT/lib/ncarg/nclscripts/csm/gsn_csm.ncl"
> load "$NCARG_ROOT/lib/ncarg/nclscripts/csm/contributed.ncl"
> load "$NCARG_ROOT/lib/ncarg/nclscripts/csm/shea_util.ncl"
>
> begin
>
> ;*****************************************
> ; Open workstation and define colormap *
> ;*****************************************
>
> wks_type = "png" ; use "newpdf" instead of "pdf" for smaller files
> wks_type_at_wkWidth = 1600
> wks_type_at_wkHeight = 1600
> wks = gsn_open_wks(wks_type,"temp")
> gsn_define_colormap(wks,"rainbow+white+gray") ; choose colormap
>
> ;*****************
> ; Generare map *
> ;*****************
> ;--- resouces for map
> res = True ; plot mods desired
> res_at_mpProjection = "LambertConformal" ; choose projection
>
> res = True ; plot mods desired
>
> res_at_gsnMaximize = True
> res_at_gsnDraw = False ; do not draw the plot
> res_at_gsnFrame = False ; do not flip the page
>
> res_at_mpProjection = "LambertConformal" ; choose projection
> res_at_mpLimitMode = "LatLon"
> res_at_mpMaxLonF = 47.0
> res_at_mpMaxLatF = 88.5
> res_at_mpMinLatF = 27.0
> res_at_mpMinLonF = -43.0
> res_at_mpGridAndLimbOn = True ; turn on grid lines
> res_at_mpGridLineDashPattern = 10 ; lat/lon lines dashed
>
>
> drawNDCGrid(wks)
>
> map = gsn_csm_map(wks,res)
>
> ;--- create map from shapefiles
>
> fnames = "/mnt/internetserver/map/shapefile/europa/aaa_full/" + (/"europa"/) + ".shp" ; Files to be open
> linecolors = (/"Black"/) ; color definition for each shapefile
> fillcolors = (/"Transparent"/) ; Fill color definition for each shapefile
> thicks = (/2/) ; Thickness for each shapefile
> lnres = True ; resources for polylines
> plres = True
> prims = True
> lines = True
> do n=0,dimsizes(fnames)-1 ; Loop through files that we want to read geographic information from.
> f = addfile(fnames(n),"r") ; Open the shapefile number n.
> segments = f->segments ; Read data off the shapefile
> geometry = f->geometry
> segsDims = dimsizes(segments)
> geomDims = dimsizes(geometry)
> geom_segIndex = f_at_geom_segIndex ; Read global attributes
> geom_numSegs = f_at_geom_numSegs
> segs_xyzIndex = f_at_segs_xyzIndex
> segs_numPnts = f_at_segs_numPnts
> geometry_type = f_at_geometry_type
> numFeatures = geomDims(0)
> lon = f->x
> lat = f->y
> if (geometry_type.eq."polygon") then ; Put if statement outside the loop
> plres_at_gsFillColor = fillcolors(n)
> plres_at_gsEdgesOn = True ; Draw border around polygons
> plres_at_gsEdgeColor = linecolors(n)
> plres_at_gsEdgeThicknessF = thicks(n)
> do i=0, numFeatures-1 ; Section to draw polygons on map.
> startSegment = geometry(i, geom_segIndex)
> numSegments = geometry(i, geom_numSegs)
> do seg=startSegment, startSegment+numSegments-1
> startPT = segments(seg, segs_xyzIndex)
> endPT = startPT + segments(seg, segs_numPnts) - 1
> dumstr = unique_string("lines") ; This call adds the polygon.
> map@$dumstr$ = gsn_add_polygon(wks, map , lon(startPT:endPT), lat(startPT:endPT), plres)
> end do
> end do
> else
> lnres_at_gsLineThicknessF = thicks(n)
> lnres_at_gsLineColor = linecolors(n)
> do i=0, numFeatures-1 ; Section to draw polylines on map.
> startSegment = geometry(i, geom_segIndex)
> numSegments = geometry(i, geom_numSegs)
> do seg=startSegment, startSegment+numSegments-1
> startPT = segments(seg, segs_xyzIndex)
> endPT = startPT + segments(seg, segs_numPnts) - 1
> dumstr = unique_string("primitive") ; This call adds the line segment.
> map@$dumstr$ = gsn_add_polyline(wks, map, lon(startPT:endPT), lat(startPT:endPT), lnres)
> end do
> end do
> end if
> delete(lat) ; Clean up before we read in same variables again.
> delete(lon)
> delete(segments)
> delete(geometry)
> delete(segsDims)
> delete(geomDims)
> end do
>
> ;******************
> ; read gfs data *
> ;******************
>
> url = "http://nomad1.ncep.noaa.gov:9090/dods/gfs_master/gfs" + systemfunc("date +%Y%m%d") + "/"
> systemdate = systemfunc("date +%H")
>
> if ((systemdate.ge.06).and.(systemdate.lt.12)) then
> filename = url + "gfs_master_00z"
> end if
> if ((systemdate.ge.12).and.(systemdate.lt.18)) then
> filename = url + "gfs_master_06z"
> end if
> if ((systemdate.ge.18).and.(systemdate.lt.24)) then
> filename = url + "gfs_master_06z"
> end if
> if ((systemdate.ge.06).and.(systemdate.lt.06)) then
> filename = url + "gfs_master_18z"
> end if
> filename = "http://nomad1.ncep.noaa.gov:9090/dods/gfs_master/gfs20110916/gfs_master_18z"
> exists = isfilepresent(filename)
> if(.not.exists) then
> print("OPeNDAP isfilepresent test unsuccessful.")
> print("Either file doesn't exist, or NCL does not have OPeNDAP capabilities on this system")
> else
> print("OPeNDAP isfilepresent test successful.")
> gfs = addfile(filename,"r")
> vars = getfilevarnames(gfs)
> end if
>
> ;*******************************
> ; 2 metres temperature plot *
> ;*******************************
> ;--- resouces for 2 metres temperature plot
> res1= True
>
> res1_at_gsnMaximize = True
> res1_at_gsnDraw = False ; do not draw the plot
> res1_at_gsnFrame = False ; do not flip the page
> res1_at_gsnAddCyclic = True
> res1_at_gsnSpreadColors = False ; turn off the use entire color map
> res1_at_gsnContourNegLineDashPattern = 10
>
>
>
>
>
>
> res1_at_cnLineDashSegLenF = 0.04
>
> res1_at_cnLinesOn = True ; turn on contour lines
> res1_at_cnLineLabelsOn = True ; turn on contour labels
> res1_at_cnLineLabelFont = "times-roman" ; set font on contour labels
> res1_at_cnLineLabelFontHeightF = 0.006 ; set font height on contour labels
> res1_at_cnLineLabelPlacementMode = "Constant" ; set placement mode of labels on contour
> res1_at_cnLineLabelBackgroundColor = "Transparent" ; set background color of the contour label
>
> res1_at_cnLevelSelectionMode = "ManualLevels" ; set how manage contour line levels
> res1_at_cnMinLevelValF = -50 ; max level do draw contour lines
> res1_at_cnMaxLevelValF = 50 ; min level do draw contour lines
> res1_at_cnLevelSpacingF = 1 ; set spacing between contour lines
> res1_at_cnLevelFlags = (/"LineAndLabel","LineOnly","LineOnly","LineOnly","LineOnly","LineAndLabel","LineOnly","LineOnly","LineOnly","LineOnly", \
> "LineAndLabel","LineOnly","LineOnly","LineOnly","LineOnly","LineAndLabel","LineOnly","LineOnly","LineOnly","LineOnly", \
> "LineAndLabel","LineOnly","LineOnly","LineOnly","LineOnly","LineAndLabel","LineOnly","LineOnly","LineOnly","LineOnly", \
> "LineAndLabel","LineOnly","LineOnly","LineOnly","LineOnly","LineAndLabel","LineOnly","LineOnly","LineOnly","LineOnly", \
> "LineAndLabel","LineOnly","LineOnly","LineOnly","LineOnly","LineAndLabel","LineOnly","LineOnly","LineOnly","LineOnly", \
> "LineAndLabel","LineOnly","LineOnly","LineOnly","LineOnly","LineAndLabel","LineOnly","LineOnly","LineOnly","LineOnly", \
> "LineAndLabel","LineOnly","LineOnly","LineOnly","LineOnly","LineAndLabel","LineOnly","LineOnly","LineOnly","LineOnly", \
> "LineAndLabel","LineOnly","LineOnly","LineOnly","LineOnly","LineAndLabel","LineOnly","LineOnly","LineOnly","LineOnly", \
> "LineAndLabel","LineOnly","LineOnly","LineOnly","LineOnly","LineAndLabel","LineOnly","LineOnly","LineOnly","LineOnly", \
> "LineAndLabel","LineOnly","LineOnly","LineOnly","LineOnly","LineAndLabel","LineOnly","LineOnly","LineOnly","LineOnly", \
> "LineAndLabel"/) ; set how draw contour lines
> res1_at_cnFillColors = (/12,14,16,18,20,22,24,26,28,30,32,34,36,38,40,42,44,46,48,50,52,54,56,58,60,62,64,66,68,70,72,74,76,78,80,82,84,86,88,90,92,94,96,98,100,102,104,106,108,110,112,114,116,118,120,122,124,128,132,136,140,144,148,152,156,160,164,166,168,170,172,174,176,178,180,182,184,186,188,190,192,194,196,198,200,202,204,206,208,210,212,214,216,218,220,222,224,226,228,230,232/)
> res1_at_cnMonoLineColor = False ; turn off auto contour line colors
> res1_at_cnLineColors = (/"Black","White","White","White","White","Black","White","White","White","White", \
> "Black","White","White","White","White","Black","White","White","White","White", \
> "Black","White","White","White","White","Black","White","White","White","White", \
> "Black","White","White","White","White","Black","White","White","White","White", \
> "Black","White","White","White","White","Black","White","White","White","White", \
> "Black","White","White","White","White","Black","White","White","White","White", \
> "Black","White","White","White","White","Black","White","White","White","White", \
> "Black","White","White","White","White","Black","White","White","White","White", \
> "Black","White","White","White","White","Black","White","White","White","White", \
> "Black","White","White","white","White","Black","White","White","White","White", \
> "Black"/) ; set contour lines colors
> res1_at_cnMonoLineThickness = False ; turn off auto contour line thickness
> res1_at_cnLineThicknesses = (/1.0,0.5,0.5,0.5,0.5,1.0,0.5,0.5,0.5,0.5, \
> 1.0,0.5,0.5,0.5,0.5,1.0,0.5,0.5,0.5,0.5, \
> 1.0,0.5,0.5,0.5,0.5,1.0,0.5,0.5,0.5,0.5, \
> 1.0,0.5,0.5,0.5,0.5,1.0,0.5,0.5,0.5,0.5, \
> 1.0,0.5,0.5,0.5,0.5,1.0,0.5,0.5,0.5,0.5, \
> 1.0,0.5,0.5,0.5,0.5,1.0,0.5,0.5,0.5,0.5, \
> 1.0,0.5,0.5,0.5,0.5,1.0,0.5,0.5,0.5,0.5, \
> 1.0,0.5,0.5,0.5,0.5,1.0,0.5,0.5,0.5,0.5, \
> 1.0,0.5,0.5,0.5,0.5,1.0,0.5,0.5,0.5,0.5, \
> 1.0,0.5,0.5,0.5,0.5,1.0,0.5,0.5,0.5,0.5, \
> 1.0/) ; set contour lines thickness
>
> res1_at_lbLabelsOn = True ; turn on the labels
> ;res1_at_lbLabelAutoStride = False ; let NCL determine label spacing
> res1_at_lbLeftMarginF = 0.001
> res1_at_lbOrientation = "horizontal" ; label orientation
> res1_at_lbBoxLinesOn = True ; turn on lines between labelbar colors
> res1_at_lbLabelFont= "times-roman" ; font
> res1_at_lbLabelFontHeightF= 0.005 ; set the label size
> res1_at_lbLabelAlignment = "BoxCenters"
> res1_at_pmLabelBarHeightF = 0.04
> res1_at_lbLabelStride = 2 ; label every other box
>
>
> res1_at_cnFillOn = True ; turn on color
>
>
>
>
>
>
> ;---data for 2 metres temperature plot
>
> TEMP2M = gfs->tmp2m(:,:,:) ; temperature
> NTIMES = dimsizes(gfs->time) ; number of times in the file
> TEMP2M = TEMP2M - 273.15
> TEMP2M_at_units = "(C)"
> TEMP2M_at_long_name = "Temperatura a 2 metri dal suolo"
> do it = 0,1 ;NTIMES-1
> plot = gsn_csm_contour(wks,TEMP2M(it,:,:),res1)
> overlay(map,plot)
> draw(map)
> frame(wks)
> end do
> do it = 0,1 ;NTIMES-1
> if (it.le.8) then
> system("mv temp.00000" + (it+1) + ".png" + " temperatura0" + (it) + "_" + systemfunc("date +%Y%m%d%H") + ".png")
> end if
> if (it.eq.9) then
> system("mv temp.0000" + (it+1) + ".png" + " temperatura0" + (it) + "_" + systemfunc("date +%Y%m%d%H") + ".png")
> end if
> if (it.ge.10) then
> system("mv temp.0000" + (it+1) + ".png" + " temperatura" + (it) + "_" + systemfunc("date +%Y%m%d%H") + ".png")
> end if
> end do
> end
>
-------------- next part --------------
An HTML attachment was scrubbed...
URL: http://mailman.ucar.edu/pipermail/ncl-talk/attachments/20110921/f616cbe5/attachment.html
------------------------------
_______________________________________________
ncl-talk mailing list
ncl-talk_at_ucar.edu
http://mailman.ucar.edu/mailman/listinfo/ncl-talk
End of ncl-talk Digest, Vol 94, Issue 55
****************************************
_______________________________________________
ncl-talk mailing list
List instructions, subscriber options, unsubscribe:
http://mailman.ucar.edu/mailman/listinfo/ncl-talk
Received on Thu Sep 22 11:46:21 2011
This archive was generated by hypermail 2.1.8 : Thu Sep 22 2011 - 17:12:44 MDT