NCL Home>
Application examples>
Plot techniques ||
Data files for some examples
Example pages containing:
tips |
resources |
functions/procedures
NCL Graphics: Controlling the draw order of plot elements
This page describes how to control the draw order of various plot elements,
like contour lines, filled contours, XY curves, vectors, map outlines,
polygons, markers, etc.
Controlling the draw order involves the use of "DrawOrder" resources
that indicate which of three phases a set of elements are drawn in:
"PreDraw", "Draw", or "PostDraw".
There are several draw order
resources. The tfPolyDrawOrder
resource is a special one for primitives (polygons, polylines, and
polymarkers):
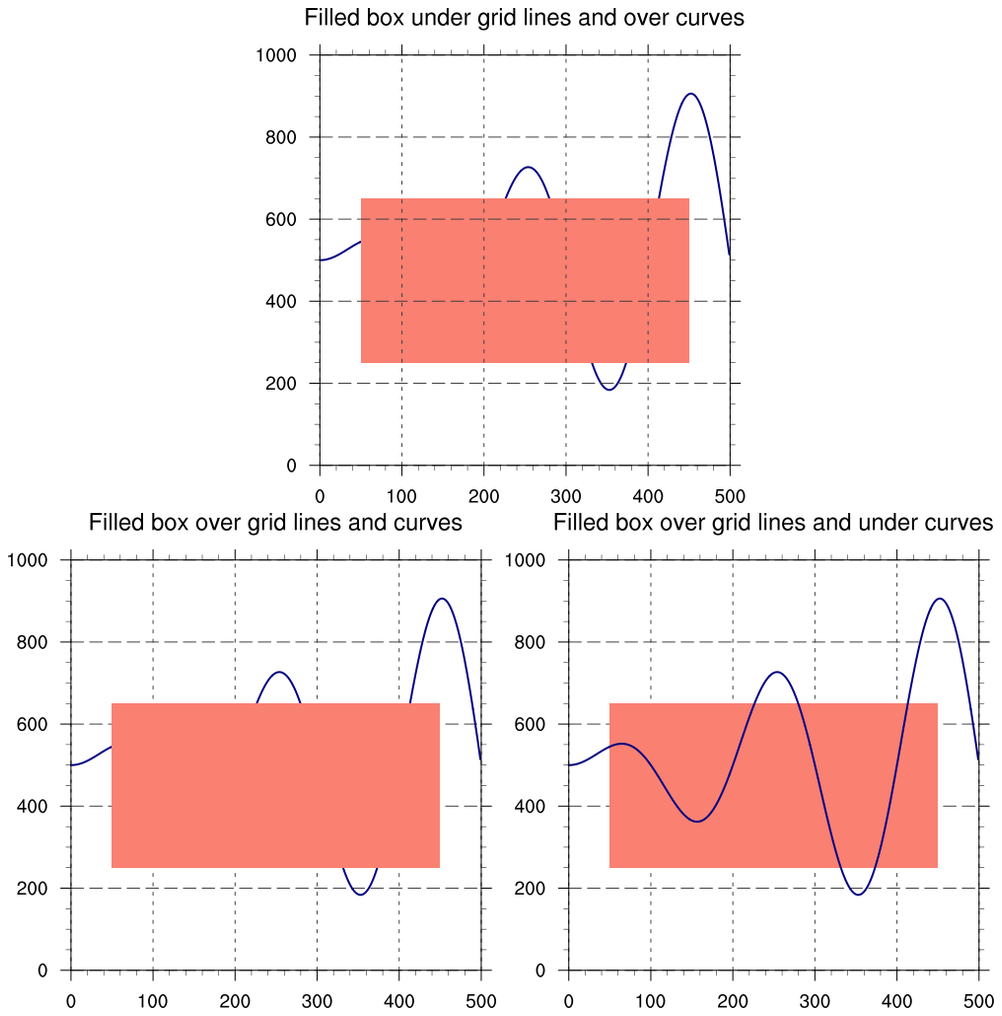
 draworder_1.ncl
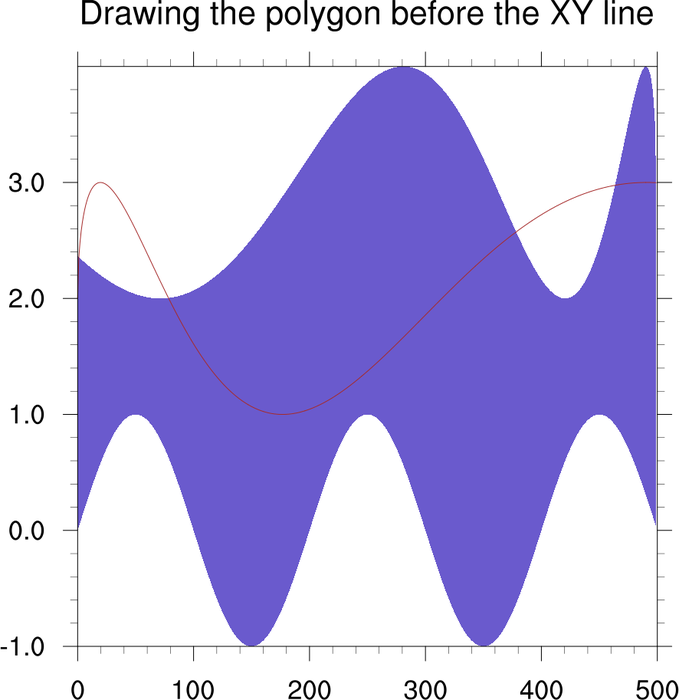
: This example shows
how to attach a polygon to an XY plot, setting
tfPolyDrawOrder to "Draw" to force the
polygon to be drawn first (the default is "PostDraw"). If you don't
set this, the polygon will mask part of the line.
Note: this script requires a bug fix that was added after V5.1.1 was
released. To run this example with V5.1.1 and earlier, try draworder_1_fix.ncl for a
work-around.
As of V5.2.0, you can set tfPolyDrawOrder when calling gsn_add_polygon. Before V5.2.0, you had to
set this resource when calling the plotting function (gsn_y).
To run this example with V5.1.1 and earlier,
try draworder_1_fix.ncl for
a work-around.

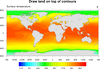 draworder_2.ncl
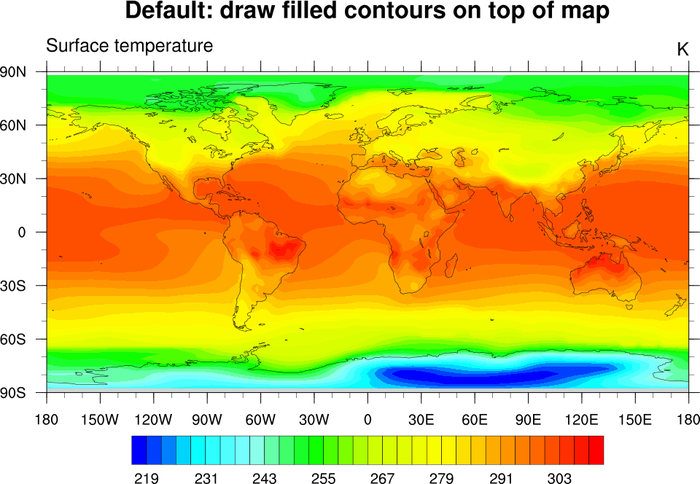
: This example shows
how to force the filled contours to be drawn before filled map areas
by setting
cnFillDrawOrder to
"PreDraw". The
mpFillDrawOrder
resource defaults to "Draw", so these filled areas get drawn after
elements in the "PreDraw" phase.
The first frame shows the default draw order, the second frame
draws the filled contours first.
Note: The land is filled in gray by default in the latest version of NCL.
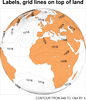
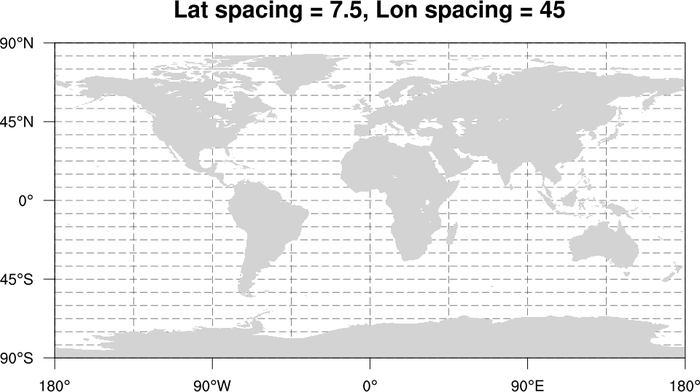
 draworder_3.ncl
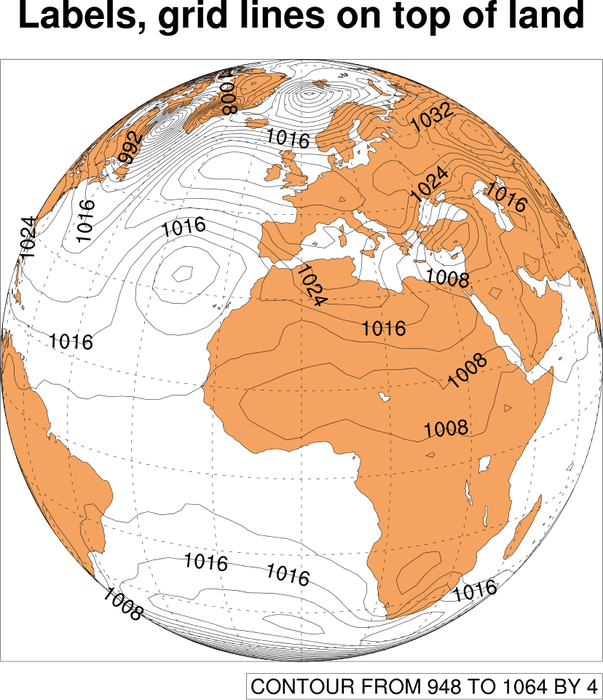
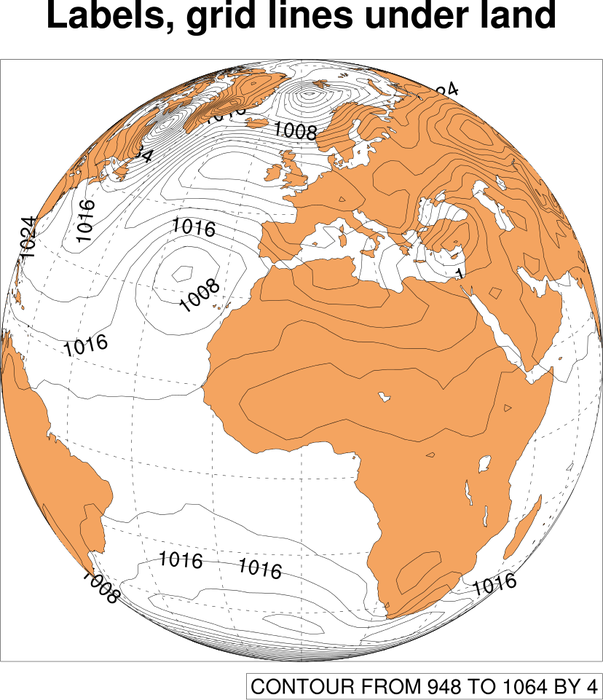
: This example shows
how to force map grid lines and contour labels to be drawn before
filled map areas by setting
cnLabelDrawOrder and
mpGridAndLimbDrawOrder to "PreDraw".
The first frame shows the default draw order, the second frame
shows the changed draw order
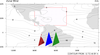 draworder_4.ncl
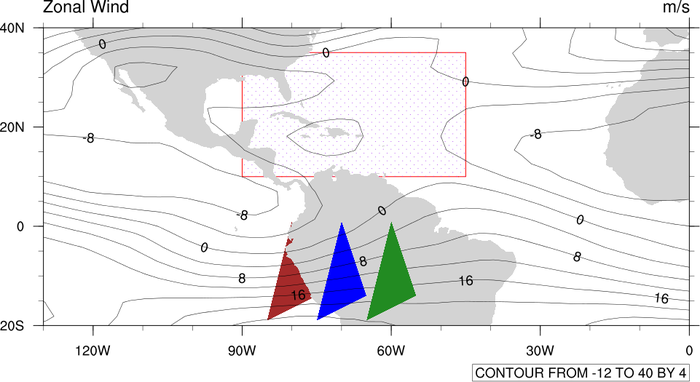
:
This example shows how to attach polygons and polylines
to a map plot, using different "draw order" phases.
Whenever you attach primitives to a plot, you can
only set tfPolyDrawOrder
once for all those primitives. In order to have
different draw orders for each primitive, then, you
must create a dummy object (called a "LogLin plot"),
overlay this on the map, and then use this new
object to attach your primitives to.
Note: this script requires a bug fix that was added after V5.1.1 was
released. To run this example with V5.1.1 and earlier, try draworder_4_fix.ncl for a
work-around.
In this script, see how the three triangles are drawn during
different phases. This is done by creating special objects
for the blue and green triangles.
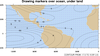 draworder_5.ncl
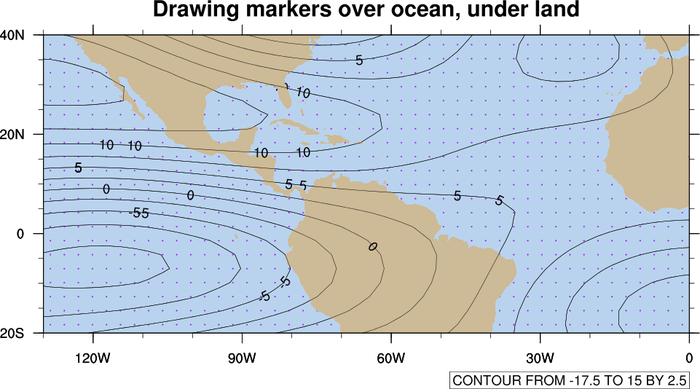
:
This example shows how to attach polymarkers
to a map plot, such that the markers are drawn over filled
ocean areas, but under filled land areas.
To do this, you must create two map plots: one with filled land and
transparent ocean, and one with filled ocean and transparent
land. This way you can attach the markers to the ocean-filled plot,
and then overlay the land-filled plot which will mask the markers.
To make sure the two maps stay together if you resize them, this
script adds one as an annotation of the other using gsn_add_annotation.
 polyg_12.ncl
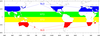
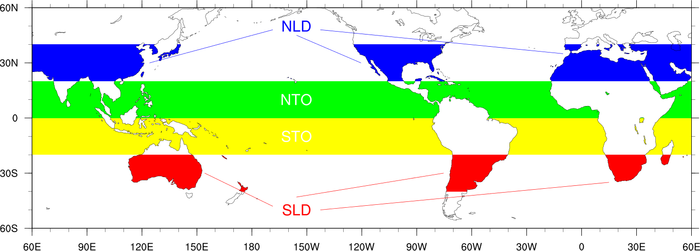
:
This example shows how to layer various polygons on
a map to get a particular effect.
As the extratropical polygons (red/blue) require the ocean to overlay
the polygons, and the tropical polygons (green/yellow) require the
land to overlay the polygons, the only way to get the desired effect
is to draw two plots, and to
set tfPolyDrawOrder equal to
Draw.
A third blank plot is drawn over the previous two to draw the border
correctly.
This is a reproduction of figure 1b from Kutzbach et al. 2008, Climate
Dynamics, 30:567-579.
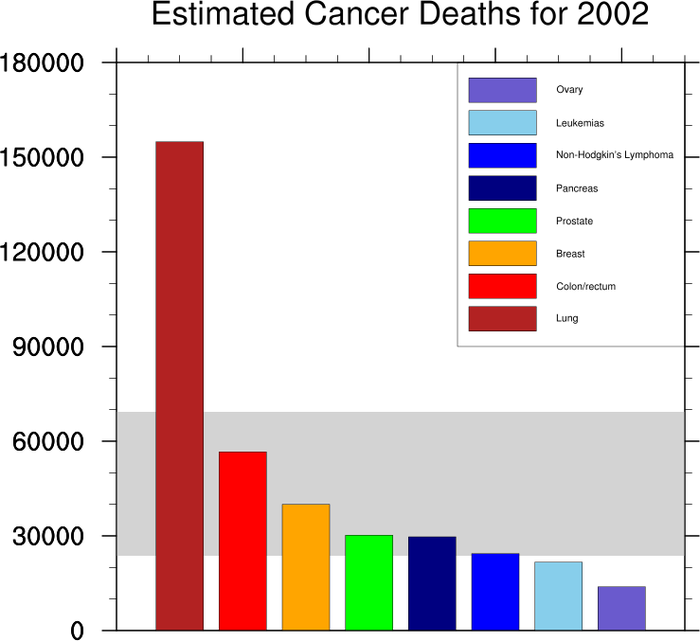
 draworder_6.ncl
:
This example shows how to use a blank plot and
overlay to force a gray polygon
box to be drawn under other polygons that are part of a bar chart.
This is necessary because
the tfPolyDrawOrder resources
applies to all elements attached to a single plot, and there's no way
to control the draw order of individual elements.
By using a blank plot, we can draw the gray box in the blank plot,
and then overlay the bar chart on the blank plot, forcing the
gray box to be underneath everything.
