Hi Mark,
With regards to Q1:
After talking to the developers your only option is to put the station
data on a grid by using, say, triple2grid, and then mask the resulting
output.
http://www.ncl.ucar.edu/Document/Functions/Built-in/triple2grid.shtml
The general feeling about this is that this is very difficult to do, as
you are interpolating between your outermost station points and, well,
nothing.. Adam
On 09/22/2011 09:46 AM, Mark Chan wrote:
> Hi Adam,
>
> Thanks a lot for your answer. It works fine, though I am still waiting
> an answer for the question 1.
>
> Best regards,
> Mark
>
> ------------------------------------------------------------------------
> *From:* "ncl-talk-request@ucar.edu" <ncl-talk-request@ucar.edu>
> *To:* ncl-talk@ucar.edu
> *Sent:* Thursday, September 22, 2011 2:50 AM
> *Subject:* ncl-talk Digest, Vol 94, Issue 55
>
> Send ncl-talk mailing list submissions to
> ncl-talk@ucar.edu <mailto:ncl-talk@ucar.edu>
>
> To subscribe or unsubscribe via the World Wide Web, visit
> http://mailman.ucar.edu/mailman/listinfo/ncl-talk
> or, via email, send a message with subject or body 'help' to
> ncl-talk-request@ucar.edu <mailto:ncl-talk-request@ucar.edu>
>
> You can reach the person managing the list at
> ncl-talk-owner@ucar.edu <mailto:ncl-talk-owner@ucar.edu>
>
> When replying, please edit your Subject line so it is more specific
> than "Re: Contents of ncl-talk digest..."
>
>
> Today's Topics:
>
> 1. Re: plot station data and adding polygon from shape file
> (Adam Phillips)
> 2. Re: ncl_fnl (Mary Haley)
> 3. Re: question of install ncl under linux (Mary Haley)
> 4. Re: emacs ncl-mode is still being maintained.? (Mary Haley)
> 5. Re: Stil label bar problems (David Brown)
> 6. Re: Stil label bar problems (Mary Haley)
>
>
> ----------------------------------------------------------------------
>
> Message: 1
> Date: Wed, 21 Sep 2011 16:36:12 -0600
> From: Adam Phillips <asphilli@ucar.edu <mailto:asphilli@ucar.edu>>
> Subject: Re: plot station data and adding polygon from
> shape file
> To: ncl-talk@ucar.edu <mailto:ncl-talk@ucar.edu>
> Message-ID: <4E7A66DC.8050904@ucar.edu <mailto:4E7A66DC.8050904@ucar.edu>>
> Content-Type: text/plain; charset=ISO-8859-1; format=flowed
>
> Hi Mark,
> I can answer questions 2 and 3.. Someone else will have to chime in for
> question #1... answers are below
>
> On 09/21/2011 11:59 AM, Mark Chan wrote:
> > Dear NCL users,
> >
> > The attached files are NCL script and its plot (I didn't attach data
> > file since it is too big).
> >
> > My questions are as:
> >
> > question 1: How to plot the station data by extrapolation so the plot
> > could cover the whole target region?
> > question 2: The boundary is another shape file, how to change the
> > "boundary line" ( lnres@gsLineThicknessF = 2.0), make it different from
> > the line inside target region.
>
> Right now you are calling attach_shapefile_polyline to draw your
> polylines. You are passing in the file, the workstation, the plot, and
> the line_color. I would pass through a 5th array, a generic attribute
> array (more complicated), or simply a float value denoting the line
> thickness.
> change this:
> function attach_shapefile_polyline(f:file,wks,plot,line_color)
> to this:
> function attach_shapefile_polyline(f:file,wks,plot,line_color,lt)
>
> change this:
> lnres@gsLineThicknessF = 1.0
> to this:
> lnres@gsLineThicknessF = lt
>
> and these:
> map = attach_shapefile_polyline(f2,wks,map,"white")
> map = attach_shapefile_polyline(f1,wks,map,"black")
> to these:
> map = attach_shapefile_polyline(f2,wks,map,"white",1.0)
> map = attach_shapefile_polyline(f1,wks,map,"black",2.0)
>
> > question 3: I also want to display the mark points, how to bring the
> > mark to the front.
>
> You need to tell NCL to draw the mark points last. You can do that by
> altering the draw order:
> http://www.ncl.ucar.edu/Applications/draworder.shtml
>
> Specifically, you want to set mkres@tfPolyDrawOrder = "PostDraw"
> Hope that helps!
> Adam
>
> >
> > Thanks very much!
> > Mark
> >
> >
> >
> > _______________________________________________
> > ncl-talk mailing list
> > List instructions, subscriber options, unsubscribe:
> > http://mailman.ucar.edu/mailman/listinfo/ncl-talk
>
> --
> ______________________________________________________________
> Adam Phillips asphilli@ucar.edu <mailto:asphilli@ucar.edu>
> NCAR/Climate and Global Dynamics Division (303) 497-1726
> P.O. Box 3000
> Boulder, CO 80307-3000 http://www.cgd.ucar.edu/cas/asphilli
>
>
> ------------------------------
>
> Message: 2
> Date: Wed, 21 Sep 2011 20:02:55 -0400
> From: Mary Haley <haley@ucar.edu <mailto:haley@ucar.edu>>
> Subject: Re: ncl_fnl
> To: cnl88 <cnl88@163.com <mailto:cnl88@163.com>>
> Cc: ncl-talk@ucar.edu <mailto:ncl-talk@ucar.edu>
> Message-ID: <E6D77491-937C-4BE3-834D-6BAA00A5114E@ucar.edu
> <mailto:E6D77491-937C-4BE3-834D-6BAA00A5114E@ucar.edu>>
> Content-Type: text/plain; charset="utf-8"
>
> You have the following resource set, which might be thinning your
> vectors quite a bit:
>
> res@vcMinDistanceF = 0.025 ; thin out windbarbs
>
>
> You actually have this resource set twice, so try commenting out both
> settings and see if you get more vectors.
>
> --Mary
>
> On Sep 21, 2011, at 5:16 AM, cnl88 wrote:
>
> >
> > <??1.png>
> >
> > I used the data of fnl to draw the wind of east asia. but I change
> the fanction
> > from plot=gsn_csm_vector_map(wks,u,v,res) to
> > plot=gsn_csm_vector_map(wks,u(::2,::2),v(::2,::2),res) or
> > from plot=gsn_csm_vector_map(wks,u(::3,::3),v(::3,::3),res) to
> > plot=gsn_csm_vector_map(wks,u(::5,::5),v(::5,::5),res) the results
> were the same !Ido not know why .i want to increase the density of the
> wind .how should i do ??
> >
> >
> > <fnl_201104new2.ncl>_______________________________________________
> > ncl-talk mailing list
> > List instructions, subscriber options, unsubscribe:
> > http://mailman.ucar.edu/mailman/listinfo/ncl-talk
>
> -------------- next part --------------
> An HTML attachment was scrubbed...
> URL:
> http://mailman.ucar.edu/pipermail/ncl-talk/attachments/20110921/ee6798e2/attachment.html
>
>
> ------------------------------
>
> Message: 3
> Date: Wed, 21 Sep 2011 20:04:28 -0400
> From: Mary Haley <haley@ucar.edu <mailto:haley@ucar.edu>>
> Subject: Re: question of install ncl under linux
> To: ??? <niugt04@126.com <mailto:niugt04@126.com>>
> Cc: "ncl-talk@ucar.edu <mailto:ncl-talk@ucar.edu>" <ncl-talk@ucar.edu
> <mailto:ncl-talk@ucar.edu>>
> Message-ID: <73EC9C98-31A2-4855-95DE-236426FD27BC@ucar.edu
> <mailto:73EC9C98-31A2-4855-95DE-236426FD27BC@ucar.edu>>
> Content-Type: text/plain; charset="utf-8"
>
> It lokos like you don't have NCARG_ROOT set.
>
> Plese see:
>
> http://www.ncl.ucar.edu/Download/install.shtml#SetNCARG_ROOT
>
> --Mary
>
>
> On Sep 21, 2011, at 11:42 AM, ??? wrote:
>
> > when I run ncl,it gives warning as:
> >
> > name@a4700:~> ncl. G7 X/ x- I# G0 \- U: H! B
> > Copyright (C) 1995-2009 - All Rights Reserved
> > University Corporation for Atmospheric Research
> > NCAR Command Language Version 5.1.1
> > The use of this software is governed by a License Agreement.
> > See http://www.ncl.ucar.edu/ for more details.
> > /lib/ncarg/sysresfiled System Resource File /home/name/ncl
> > warning:WorkstationClassInitialize:Unable to access rgb color
> database - named colors unsupported:[errno=2]
> > /lib/ncarg/colormaps:1533]:NhlLoadColormapFiles: Invalid colormap
> directory: /home/name/ncl
> > ncl 0>
> > 2011-09-21
> > ???
> > _______________________________________________
> > ncl-talk mailing list
> > List instructions, subscriber options, unsubscribe:
> > http://mailman.ucar.edu/mailman/listinfo/ncl-talk
>
> -------------- next part --------------
> An HTML attachment was scrubbed...
> URL:
> http://mailman.ucar.edu/pipermail/ncl-talk/attachments/20110921/7e891fa3/attachment.html
>
>
> ------------------------------
>
> Message: 4
> Date: Wed, 21 Sep 2011 20:26:21 -0400
> From: Mary Haley <haley@ucar.edu <mailto:haley@ucar.edu>>
> Subject: Re: emacs ncl-mode is still being maintained.?
> To: yagnesh <yagnesh@lowtem.hokudai.ac.jp
> <mailto:yagnesh@lowtem.hokudai.ac.jp>>
> Cc: ncl-talk <ncl-talk@ucar.edu <mailto:ncl-talk@ucar.edu>>
> Message-ID: <1D9DA6BA-01E6-4C45-BE01-3EB24F107EEC@ucar.edu
> <mailto:1D9DA6BA-01E6-4C45-BE01-3EB24F107EEC@ucar.edu>>
> Content-Type: text/plain; charset="us-ascii"
>
> Please see the updated version at:
>
> http://www.ncl.ucar.edu/Applications/Files/ncl.el
>
> --Mary
>
> On Sep 20, 2011, at 7:22 PM, yagnesh wrote:
>
> > On 09/21/2011 01:27 AM, Mary Haley wrote:
> >
> > Hello Mary.,
> >
> > Thanks for the reply.,
> >
> > > I use ncl.el all the time, so I
> > should update it myself. I'll do that shortly and put a new
> > version out. I'll even put a new date on it. :-)
> >
> > >
> >
> > > --Mary
> >
> > >
> >
> > Thank you and looking forward to see the new version of ncl.el.
> >
> > By the Way.. I tried to make a dictionary consisting of all the
> keywords of
> > ncl to make use of auto-completion system.
> >
> > I parsed these two pages (functions & resources)
> >
> > http://www.ncl.ucar.edu/Document/Functions/list_alpha.shtml
> > http://www.ncl.ucar.edu/Document/Graphics/Resources/list_alpha_res.shtml
> >
> > and collected the keywords.,
> >
> > my question is, this makes a full list.? or am I missing any other
> > keywords.?
> >
> > --
> > Yagnesh
> > Hokkaido University.
> >
>
> -------------- next part --------------
> An HTML attachment was scrubbed...
> URL:
> http://mailman.ucar.edu/pipermail/ncl-talk/attachments/20110921/8a0eaed2/attachment.html
>
>
> ------------------------------
>
> Message: 5
> Date: Wed, 21 Sep 2011 18:45:22 -0600
> From: David Brown <dbrown@ucar.edu <mailto:dbrown@ucar.edu>>
> Subject: Re: Stil label bar problems
> To: ugo merlini <ugomerlini@hotmail.com <mailto:ugomerlini@hotmail.com>>
> Cc: ncl-talk@ucar.edu <mailto:ncl-talk@ucar.edu>
> Message-ID: <8B08163F-22D1-40CD-B27B-0DC549AFB50C@ucar.edu
> <mailto:8B08163F-22D1-40CD-B27B-0DC549AFB50C@ucar.edu>>
> Content-Type: text/plain; charset="us-ascii"
>
> You have 101 levels (-50 -- +50 w/ step size 1) and cnFillColors is set
> with 101 colors. If you read the documentation for cnFillColors you will
> see that it needs to have one more color than there are levels. That is
> so values both below the minimum level and above the maximum level can
> be assigned a color. I think you simply need to add one more color index
> value to cnFillColors.
> -dave
>
> On Sep 21, 2011, at 4:23 PM, ugo merlini wrote:
>
> > Hi
> >
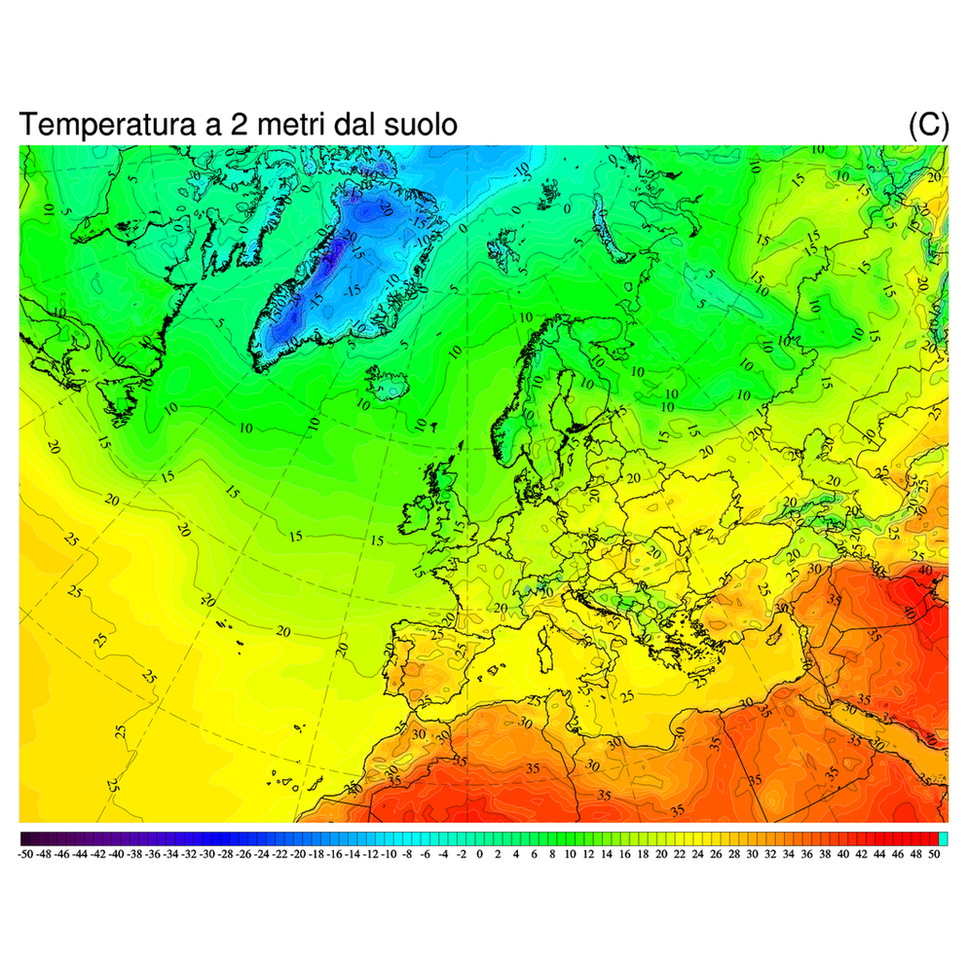
> > I still have label bar problem as can be seen on picture below at the
> end of the label bar there is a light blue box which in teory is not
> part of the labal bar
> >
> > How delete it?
> >
> > ugo
> >
> >
> >
> http://i103.photobucket.com/albums/m136/ugo73/temperatura02_2011092123.png
> >
> >
> >
> >
> >
> >
> >
> > ;----------------------------------------------------------------------
> > ; This example shows how to read geographic data
> > ; from Natural Earth shapefiles
> > ; and plot them as polylines and polygons.
> > ;----------------------------------------------------------------------
> > ; This particular example plots data for Switzerland.
> > ;----------------------------------------------------------------------
> > ; Download the shapefiles from http://www.naturalearthdata.com/
> > ; Unzip to a directory
> > ;----------------------------------------------------------------------
> >
> > load "$NCARG_ROOT/lib/ncarg/nclscripts/csm/gsn_code.ncl"
> > load "$NCARG_ROOT/lib/ncarg/nclscripts/csm/gsn_csm.ncl"
> > load "$NCARG_ROOT/lib/ncarg/nclscripts/csm/contributed.ncl"
> > load "$NCARG_ROOT/lib/ncarg/nclscripts/csm/shea_util.ncl"
> >
> > begin
> >
> > ;*****************************************
> > ; Open workstation and define colormap *
> > ;*****************************************
> >
> > wks_type = "png" ; use "newpdf" instead of "pdf" for smaller files
> > wks_type@wkWidth = 1600
> > wks_type@wkHeight = 1600
> > wks = gsn_open_wks(wks_type,"temp")
> > gsn_define_colormap(wks,"rainbow+white+gray") ; choose colormap
> >
> > ;*****************
> > ; Generare map *
> > ;*****************
> > ;--- resouces for map
> > res = True ; plot mods desired
> > res@mpProjection = "LambertConformal" ; choose projection
> >
> > res = True ; plot mods desired
> >
> > res@gsnMaximize = True
> > res@gsnDraw = False ; do not draw the plot
> > res@gsnFrame = False ; do not flip the page
> >
> > res@mpProjection = "LambertConformal" ; choose projection
> > res@mpLimitMode = "LatLon"
> > res@mpMaxLonF = 47.0
> > res@mpMaxLatF = 88.5
> > res@mpMinLatF = 27.0
> > res@mpMinLonF = -43.0
> > res@mpGridAndLimbOn = True ; turn on grid lines
> > res@mpGridLineDashPattern = 10 ; lat/lon lines dashed
> >
> >
> > drawNDCGrid(wks)
> >
> > map = gsn_csm_map(wks,res)
> >
> > ;--- create map from shapefiles
> >
> > fnames = "/mnt/internetserver/map/shapefile/europa/aaa_full/" +
> (/"europa"/) + ".shp" ; Files to be open
> > linecolors = (/"Black"/) ; color definition for each shapefile
> > fillcolors = (/"Transparent"/) ; Fill color definition for each shapefile
> > thicks = (/2/) ; Thickness for each shapefile
> > lnres = True ; resources for polylines
> > plres = True
> > prims = True
> > lines = True
> > do n=0,dimsizes(fnames)-1 ; Loop through files that we want to read
> geographic information from.
> > f = addfile(fnames(n),"r") ; Open the shapefile number n.
> > segments = f->segments ; Read data off the shapefile
> > geometry = f->geometry
> > segsDims = dimsizes(segments)
> > geomDims = dimsizes(geometry)
> > geom_segIndex = f@geom_segIndex ; Read global attributes
> > geom_numSegs = f@geom_numSegs
> > segs_xyzIndex = f@segs_xyzIndex
> > segs_numPnts = f@segs_numPnts
> > geometry_type = f@geometry_type
> > numFeatures = geomDims(0)
> > lon = f->x
> > lat = f->y
> > if (geometry_type.eq."polygon") then ; Put if statement outside the loop
> > plres@gsFillColor = fillcolors(n)
> > plres@gsEdgesOn = True ; Draw border around polygons
> > plres@gsEdgeColor = linecolors(n)
> > plres@gsEdgeThicknessF = thicks(n)
> > do i=0, numFeatures-1 ; Section to draw polygons on map.
> > startSegment = geometry(i, geom_segIndex)
> > numSegments = geometry(i, geom_numSegs)
> > do seg=startSegment, startSegment+numSegments-1
> > startPT = segments(seg, segs_xyzIndex)
> > endPT = startPT + segments(seg, segs_numPnts) - 1
> > dumstr = unique_string("lines") ; This call adds the polygon.
> > map@$dumstr$ = gsn_add_polygon(wks, map , lon(startPT:endPT),
> lat(startPT:endPT), plres)
> > end do
> > end do
> > else
> > lnres@gsLineThicknessF = thicks(n)
> > lnres@gsLineColor = linecolors(n)
> > do i=0, numFeatures-1 ; Section to draw polylines on map.
> > startSegment = geometry(i, geom_segIndex)
> > numSegments = geometry(i, geom_numSegs)
> > do seg=startSegment, startSegment+numSegments-1
> > startPT = segments(seg, segs_xyzIndex)
> > endPT = startPT + segments(seg, segs_numPnts) - 1
> > dumstr = unique_string("primitive") ; This call adds the line segment.
> > map@$dumstr$ = gsn_add_polyline(wks, map, lon(startPT:endPT),
> lat(startPT:endPT), lnres)
> > end do
> > end do
> > end if
> > delete(lat) ; Clean up before we read in same variables again.
> > delete(lon)
> > delete(segments)
> > delete(geometry)
> > delete(segsDims)
> > delete(geomDims)
> > end do
> >
> > ;******************
> > ; read gfs data *
> > ;******************
> >
> > url = "http://nomad1.ncep.noaa.gov:9090/dods/gfs_master/gfs" +
> systemfunc("date +%Y%m%d") + "/"
> > systemdate = systemfunc("date +%H")
> >
> > if ((systemdate.ge.06).and.(systemdate.lt.12)) then
> > filename = url + "gfs_master_00z"
> > end if
> > if ((systemdate.ge.12).and.(systemdate.lt.18)) then
> > filename = url + "gfs_master_06z"
> > end if
> > if ((systemdate.ge.18).and.(systemdate.lt.24)) then
> > filename = url + "gfs_master_06z"
> > end if
> > if ((systemdate.ge.06).and.(systemdate.lt.06)) then
> > filename = url + "gfs_master_18z"
> > end if
> > filename =
> "http://nomad1.ncep.noaa.gov:9090/dods/gfs_master/gfs20110916/gfs_master_18z"
> > exists = isfilepresent(filename)
> > if(.not.exists) then
> > print("OPeNDAP isfilepresent test unsuccessful.")
> > print("Either file doesn't exist, or NCL does not have OPeNDAP
> capabilities on this system")
> > else
> > print("OPeNDAP isfilepresent test successful.")
> > gfs = addfile(filename,"r")
> > vars = getfilevarnames(gfs)
> > end if
> >
> > ;*******************************
> > ; 2 metres temperature plot *
> > ;*******************************
> > ;--- resouces for 2 metres temperature plot
> > res1= True
> >
> > res1@gsnMaximize = True
> > res1@gsnDraw = False ; do not draw the plot
> > res1@gsnFrame = False ; do not flip the page
> > res1@gsnAddCyclic = True
> > res1@gsnSpreadColors = False ; turn off the use entire color map
> > res1@gsnContourNegLineDashPattern = 10
> >
> >
> >
> >
> >
> >
> > res1@cnLineDashSegLenF = 0.04
> >
> > res1@cnLinesOn = True ; turn on contour lines
> > res1@cnLineLabelsOn = True ; turn on contour labels
> > res1@cnLineLabelFont = "times-roman" ; set font on contour labels
> > res1@cnLineLabelFontHeightF = 0.006 ; set font height on contour labels
> > res1@cnLineLabelPlacementMode = "Constant" ; set placement mode of
> labels on contour
> > res1@cnLineLabelBackgroundColor = "Transparent" ; set background
> color of the contour label
> >
> > res1@cnLevelSelectionMode = "ManualLevels" ; set how manage contour
> line levels
> > res1@cnMinLevelValF = -50 ; max level do draw contour lines
> > res1@cnMaxLevelValF = 50 ; min level do draw contour lines
> > res1@cnLevelSpacingF = 1 ; set spacing between contour lines
> > res1@cnLevelFlags =
> (/"LineAndLabel","LineOnly","LineOnly","LineOnly","LineOnly","LineAndLabel","LineOnly","LineOnly","LineOnly","LineOnly",
> \
> >
> "LineAndLabel","LineOnly","LineOnly","LineOnly","LineOnly","LineAndLabel","LineOnly","LineOnly","LineOnly","LineOnly",
> \
> >
> "LineAndLabel","LineOnly","LineOnly","LineOnly","LineOnly","LineAndLabel","LineOnly","LineOnly","LineOnly","LineOnly",
> \
> >
> "LineAndLabel","LineOnly","LineOnly","LineOnly","LineOnly","LineAndLabel","LineOnly","LineOnly","LineOnly","LineOnly",
> \
> >
> "LineAndLabel","LineOnly","LineOnly","LineOnly","LineOnly","LineAndLabel","LineOnly","LineOnly","LineOnly","LineOnly",
> \
> >
> "LineAndLabel","LineOnly","LineOnly","LineOnly","LineOnly","LineAndLabel","LineOnly","LineOnly","LineOnly","LineOnly",
> \
> >
> "LineAndLabel","LineOnly","LineOnly","LineOnly","LineOnly","LineAndLabel","LineOnly","LineOnly","LineOnly","LineOnly",
> \
> >
> "LineAndLabel","LineOnly","LineOnly","LineOnly","LineOnly","LineAndLabel","LineOnly","LineOnly","LineOnly","LineOnly",
> \
> >
> "LineAndLabel","LineOnly","LineOnly","LineOnly","LineOnly","LineAndLabel","LineOnly","LineOnly","LineOnly","LineOnly",
> \
> >
> "LineAndLabel","LineOnly","LineOnly","LineOnly","LineOnly","LineAndLabel","LineOnly","LineOnly","LineOnly","LineOnly",
> \
> > "LineAndLabel"/) ; set how draw contour lines
> > res1@cnFillColors =
> (/12,14,16,18,20,22,24,26,28,30,32,34,36,38,40,42,44,46,48,50,52,54,56,58,60,62,64,66,68,70,72,74,76,78,80,82,84,86,88,90,92,94,96,98,100,102,104,106,108,110,112,114,116,118,120,122,124,128,132,136,140,144,148,152,156,160,164,166,168,170,172,174,176,178,180,182,184,186,188,190,192,194,196,198,200,202,204,206,208,210,212,214,216,218,220,222,224,226,228,230,232/)
> > res1@cnMonoLineColor = False ; turn off auto contour line colors
> > res1@cnLineColors =
> (/"Black","White","White","White","White","Black","White","White","White","White",
> \
> >
> "Black","White","White","White","White","Black","White","White","White","White",
> \
> >
> "Black","White","White","White","White","Black","White","White","White","White",
> \
> >
> "Black","White","White","White","White","Black","White","White","White","White",
> \
> >
> "Black","White","White","White","White","Black","White","White","White","White",
> \
> >
> "Black","White","White","White","White","Black","White","White","White","White",
> \
> >
> "Black","White","White","White","White","Black","White","White","White","White",
> \
> >
> "Black","White","White","White","White","Black","White","White","White","White",
> \
> >
> "Black","White","White","White","White","Black","White","White","White","White",
> \
> >
> "Black","White","White","white","White","Black","White","White","White","White",
> \
> > "Black"/) ; set contour lines colors
> > res1@cnMonoLineThickness = False ; turn off auto contour line thickness
> > res1@cnLineThicknesses = (/1.0,0.5,0.5,0.5,0.5,1.0,0.5,0.5,0.5,0.5, \
> > 1.0,0.5,0.5,0.5,0.5,1.0,0.5,0.5,0.5,0.5, \
> > 1.0,0.5,0.5,0.5,0.5,1.0,0.5,0.5,0.5,0.5, \
> > 1.0,0.5,0.5,0.5,0.5,1.0,0.5,0.5,0.5,0.5, \
> > 1.0,0.5,0.5,0.5,0.5,1.0,0.5,0.5,0.5,0.5, \
> > 1.0,0.5,0.5,0.5,0.5,1.0,0.5,0.5,0.5,0.5, \
> > 1.0,0.5,0.5,0.5,0.5,1.0,0.5,0.5,0.5,0.5, \
> > 1.0,0.5,0.5,0.5,0.5,1.0,0.5,0.5,0.5,0.5, \
> > 1.0,0.5,0.5,0.5,0.5,1.0,0.5,0.5,0.5,0.5, \
> > 1.0,0.5,0.5,0.5,0.5,1.0,0.5,0.5,0.5,0.5, \
> > 1.0/) ; set contour lines thickness
> >
> > res1@lbLabelsOn = True ; turn on the labels
> > ;res1@lbLabelAutoStride = False ; let NCL determine label spacing
> > res1@lbLeftMarginF = 0.001
> > res1@lbOrientation = "horizontal" ; label orientation
> > res1@lbBoxLinesOn = True ; turn on lines between labelbar colors
> > res1@lbLabelFont= "times-roman" ; font
> > res1@lbLabelFontHeightF= 0.005 ; set the label size
> > res1@lbLabelAlignment = "BoxCenters"
> > res1@pmLabelBarHeightF = 0.04
> > res1@lbLabelStride = 2 ; label every other box
> >
> >
> > res1@cnFillOn = True ; turn on color
> >
> >
> >
> >
> >
> >
> > ;---data for 2 metres temperature plot
> >
> > TEMP2M = gfs->tmp2m(:,:,:) ; temperature
> > NTIMES = dimsizes(gfs->time) ; number of times in the file
> > TEMP2M = TEMP2M - 273.15
> > TEMP2M@units = "(C)"
> > TEMP2M@long_name = "Temperatura a 2 metri dal suolo"
> > do it = 0,1 ;NTIMES-1
> > plot = gsn_csm_contour(wks,TEMP2M(it,:,:),res1)
> > overlay(map,plot)
> > draw(map)
> > frame(wks)
> > end do
> > do it = 0,1 ;NTIMES-1
> > if (it.le.8) then
> > system("mv temp.00000" + (it+1) + ".png" + " temperatura0" + (it) +
> "_" + systemfunc("date +%Y%m%d%H") + ".png")
> > end if
> > if (it.eq.9) then
> > system("mv temp.0000" + (it+1) + ".png" + " temperatura0" + (it) +
> "_" + systemfunc("date +%Y%m%d%H") + ".png")
> > end if
> > if (it.ge.10) then
> > system("mv temp.0000" + (it+1) + ".png" + " temperatura" + (it) + "_"
> + systemfunc("date +%Y%m%d%H") + ".png")
> > end if
> > end do
> > end
> >
> >
> > _______________________________________________
> > ncl-talk mailing list
> > List instructions, subscriber options, unsubscribe:
> > http://mailman.ucar.edu/mailman/listinfo/ncl-talk
>
> -------------- next part --------------
> An HTML attachment was scrubbed...
> URL:
> http://mailman.ucar.edu/pipermail/ncl-talk/attachments/20110921/4a56ab92/attachment.html
>
>
> ------------------------------
>
> Message: 6
> Date: Wed, 21 Sep 2011 20:50:30 -0400
> From: Mary Haley <haley@ucar.edu <mailto:haley@ucar.edu>>
> Subject: Re: Stil label bar problems
> To: ugo merlini <ugomerlini@hotmail.com <mailto:ugomerlini@hotmail.com>>
> Cc: ncl-talk@ucar.edu <mailto:ncl-talk@ucar.edu>
> Message-ID: <50449D11-EB83-4B09-84B9-F13EECA224BC@ucar.edu
> <mailto:50449D11-EB83-4B09-84B9-F13EECA224BC@ucar.edu>>
> Content-Type: text/plain; charset="us-ascii"
>
> This is the same problem you had before, that I sent you a solution for
> on September 12.
>
> You are not providing enough fill colors for the cnFillColors resource.
>
> When you set the contour levels via:
>
> res1@cnMinLevelValF = -50 ; max level do draw contour lines
> res1@cnMaxLevelValF = 50 ; min level do draw contour lines
> res1@cnLevelSpacingF = 1 ; set spacing between contour lines
>
> You are effectively generating 101 contour levels. These levels
> represent the values *between* colors, so by default, you must have one
> more color in your cnFillColors array than you have contour levels.
>
> You are only providing 101 colors, and hence NCL comes up with the extra
> one it needs. Add one more color to the setting of the cnFillColors
> resource, and you should be okay.
>
> However, there may be another issue: you are setting the labelbar label
> alignment to "center". This means that you now need to come up with one
> more label, because by default, these labels are supposed to represent
> the lines between each color, and not each color itself.
>
> You may need to set lbLabelStrings to fix this problem.
>
> Please reread the message I sent you a couple of weeks ago:
>
> http://www.ncl.ucar.edu/Support/talk_archives/2011/2165.html
>
> --Mary
>
> On Sep 21, 2011, at 6:23 PM, ugo merlini wrote:
>
> > ;----------------------------------------------------------------------
> > ; Download the shapefiles from http://www.naturalearthdata.com/
> > ; Unzip to a directory
> > ;----------------------------------------------------------------------
> >
> > load "$NCARG_ROOT/lib/ncarg/nclscripts/csm/gsn_code.ncl"
> > load "$NCARG_ROOT/lib/ncarg/nclscripts/csm/gsn_csm.ncl"
> > load "$NCARG_ROOT/lib/ncarg/nclscripts/csm/contributed.ncl"
> > load "$NCARG_ROOT/lib/ncarg/nclscripts/csm/shea_util.ncl"
> >
> > begin
> >
> > ;*****************************************
> > ; Open workstation and define colormap *
> > ;*****************************************
> >
> > wks_type = "png" ; use "newpdf" instead of "pdf" for smaller files
> > wks_type@wkWidth = 1600
> > wks_type@wkHeight = 1600
> > wks = gsn_open_wks(wks_type,"temp")
> > gsn_define_colormap(wks,"rainbow+white+gray") ; choose colormap
> >
> > ;*****************
> > ; Generare map *
> > ;*****************
> > ;--- resouces for map
> > res = True ; plot mods desired
> > res@mpProjection = "LambertConformal" ; choose projection
> >
> > res = True ; plot mods desired
> >
> > res@gsnMaximize = True
> > res@gsnDraw = False ; do not draw the plot
> > res@gsnFrame = False ; do not flip the page
> >
> > res@mpProjection = "LambertConformal" ; choose projection
> > res@mpLimitMode = "LatLon"
> > res@mpMaxLonF = 47.0
> > res@mpMaxLatF = 88.5
> > res@mpMinLatF = 27.0
> > res@mpMinLonF = -43.0
> > res@mpGridAndLimbOn = True ; turn on grid lines
> > res@mpGridLineDashPattern = 10 ; lat/lon lines dashed
> >
> >
> > drawNDCGrid(wks)
> >
> > map = gsn_csm_map(wks,res)
> >
> > ;--- create map from shapefiles
> >
> > fnames = "/mnt/internetserver/map/shapefile/europa/aaa_full/" +
> (/"europa"/) + ".shp" ; Files to be open
> > linecolors = (/"Black"/) ; color definition for each shapefile
> > fillcolors = (/"Transparent"/) ; Fill color definition for each shapefile
> > thicks = (/2/) ; Thickness for each shapefile
> > lnres = True ; resources for polylines
> > plres = True
> > prims = True
> > lines = True
> > do n=0,dimsizes(fnames)-1 ; Loop through files that we want to read
> geographic information from.
> > f = addfile(fnames(n),"r") ; Open the shapefile number n.
> > segments = f->segments ; Read data off the shapefile
> > geometry = f->geometry
> > segsDims = dimsizes(segments)
> > geomDims = dimsizes(geometry)
> > geom_segIndex = f@geom_segIndex ; Read global attributes
> > geom_numSegs = f@geom_numSegs
> > segs_xyzIndex = f@segs_xyzIndex
> > segs_numPnts = f@segs_numPnts
> > geometry_type = f@geometry_type
> > numFeatures = geomDims(0)
> > lon = f->x
> > lat = f->y
> > if (geometry_type.eq."polygon") then ; Put if statement outside the loop
> > plres@gsFillColor = fillcolors(n)
> > plres@gsEdgesOn = True ; Draw border around polygons
> > plres@gsEdgeColor = linecolors(n)
> > plres@gsEdgeThicknessF = thicks(n)
> > do i=0, numFeatures-1 ; Section to draw polygons on map.
> > startSegment = geometry(i, geom_segIndex)
> > numSegments = geometry(i, geom_numSegs)
> > do seg=startSegment, startSegment+numSegments-1
> > startPT = segments(seg, segs_xyzIndex)
> > endPT = startPT + segments(seg, segs_numPnts) - 1
> > dumstr = unique_string("lines") ; This call adds the polygon.
> > map@$dumstr$ = gsn_add_polygon(wks, map , lon(startPT:endPT),
> lat(startPT:endPT), plres)
> > end do
> > end do
> > else
> > lnres@gsLineThicknessF = thicks(n)
> > lnres@gsLineColor = linecolors(n)
> > do i=0, numFeatures-1 ; Section to draw polylines on map.
> > startSegment = geometry(i, geom_segIndex)
> > numSegments = geometry(i, geom_numSegs)
> > do seg=startSegment, startSegment+numSegments-1
> > startPT = segments(seg, segs_xyzIndex)
> > endPT = startPT + segments(seg, segs_numPnts) - 1
> > dumstr = unique_string("primitive") ; This call adds the line segment.
> > map@$dumstr$ = gsn_add_polyline(wks, map, lon(startPT:endPT),
> lat(startPT:endPT), lnres)
> > end do
> > end do
> > end if
> > delete(lat) ; Clean up before we read in same variables again.
> > delete(lon)
> > delete(segments)
> > delete(geometry)
> > delete(segsDims)
> > delete(geomDims)
> > end do
> >
> > ;******************
> > ; read gfs data *
> > ;******************
> >
> > url = "http://nomad1.ncep.noaa.gov:9090/dods/gfs_master/gfs" +
> systemfunc("date +%Y%m%d") + "/"
> > systemdate = systemfunc("date +%H")
> >
> > if ((systemdate.ge.06).and.(systemdate.lt.12)) then
> > filename = url + "gfs_master_00z"
> > end if
> > if ((systemdate.ge.12).and.(systemdate.lt.18)) then
> > filename = url + "gfs_master_06z"
> > end if
> > if ((systemdate.ge.18).and.(systemdate.lt.24)) then
> > filename = url + "gfs_master_06z"
> > end if
> > if ((systemdate.ge.06).and.(systemdate.lt.06)) then
> > filename = url + "gfs_master_18z"
> > end if
> > filename =
> "http://nomad1.ncep.noaa.gov:9090/dods/gfs_master/gfs20110916/gfs_master_18z"
> > exists = isfilepresent(filename)
> > if(.not.exists) then
> > print("OPeNDAP isfilepresent test unsuccessful.")
> > print("Either file doesn't exist, or NCL does not have OPeNDAP
> capabilities on this system")
> > else
> > print("OPeNDAP isfilepresent test successful.")
> > gfs = addfile(filename,"r")
> > vars = getfilevarnames(gfs)
> > end if
> >
> > ;*******************************
> > ; 2 metres temperature plot *
> > ;*******************************
> > ;--- resouces for 2 metres temperature plot
> > res1= True
> >
> > res1@gsnMaximize = True
> > res1@gsnDraw = False ; do not draw the plot
> > res1@gsnFrame = False ; do not flip the page
> > res1@gsnAddCyclic = True
> > res1@gsnSpreadColors = False ; turn off the use entire color map
> > res1@gsnContourNegLineDashPattern = 10
> >
> >
> >
> >
> >
> >
> > res1@cnLineDashSegLenF = 0.04
> >
> > res1@cnLinesOn = True ; turn on contour lines
> > res1@cnLineLabelsOn = True ; turn on contour labels
> > res1@cnLineLabelFont = "times-roman" ; set font on contour labels
> > res1@cnLineLabelFontHeightF = 0.006 ; set font height on contour labels
> > res1@cnLineLabelPlacementMode = "Constant" ; set placement mode of
> labels on contour
> > res1@cnLineLabelBackgroundColor = "Transparent" ; set background
> color of the contour label
> >
> > res1@cnLevelSelectionMode = "ManualLevels" ; set how manage contour
> line levels
> > res1@cnMinLevelValF = -50 ; max level do draw contour lines
> > res1@cnMaxLevelValF = 50 ; min level do draw contour lines
> > res1@cnLevelSpacingF = 1 ; set spacing between contour lines
> > res1@cnLevelFlags =
> (/"LineAndLabel","LineOnly","LineOnly","LineOnly","LineOnly","LineAndLabel","LineOnly","LineOnly","LineOnly","LineOnly",
> \
> >
> "LineAndLabel","LineOnly","LineOnly","LineOnly","LineOnly","LineAndLabel","LineOnly","LineOnly","LineOnly","LineOnly",
> \
> >
> "LineAndLabel","LineOnly","LineOnly","LineOnly","LineOnly","LineAndLabel","LineOnly","LineOnly","LineOnly","LineOnly",
> \
> >
> "LineAndLabel","LineOnly","LineOnly","LineOnly","LineOnly","LineAndLabel","LineOnly","LineOnly","LineOnly","LineOnly",
> \
> >
> "LineAndLabel","LineOnly","LineOnly","LineOnly","LineOnly","LineAndLabel","LineOnly","LineOnly","LineOnly","LineOnly",
> \
> >
> "LineAndLabel","LineOnly","LineOnly","LineOnly","LineOnly","LineAndLabel","LineOnly","LineOnly","LineOnly","LineOnly",
> \
> >
> "LineAndLabel","LineOnly","LineOnly","LineOnly","LineOnly","LineAndLabel","LineOnly","LineOnly","LineOnly","LineOnly",
> \
> >
> "LineAndLabel","LineOnly","LineOnly","LineOnly","LineOnly","LineAndLabel","LineOnly","LineOnly","LineOnly","LineOnly",
> \
> >
> "LineAndLabel","LineOnly","LineOnly","LineOnly","LineOnly","LineAndLabel","LineOnly","LineOnly","LineOnly","LineOnly",
> \
> >
> "LineAndLabel","LineOnly","LineOnly","LineOnly","LineOnly","LineAndLabel","LineOnly","LineOnly","LineOnly","LineOnly",
> \
> > "LineAndLabel"/) ; set how draw contour lines
> > res1@cnFillColors =
> (/12,14,16,18,20,22,24,26,28,30,32,34,36,38,40,42,44,46,48,50,52,54,56,58,60,62,64,66,68,70,72,74,76,78,80,82,84,86,88,90,92,94,96,98,100,102,104,106,108,110,112,114,116,118,120,122,124,128,132,136,140,144,148,152,156,160,164,166,168,170,172,174,176,178,180,182,184,186,188,190,192,194,196,198,200,202,204,206,208,210,212,214,216,218,220,222,224,226,228,230,232/)
> > res1@cnMonoLineColor = False ; turn off auto contour line colors
> > res1@cnLineColors =
> (/"Black","White","White","White","White","Black","White","White","White","White",
> \
> >
> "Black","White","White","White","White","Black","White","White","White","White",
> \
> >
> "Black","White","White","White","White","Black","White","White","White","White",
> \
> >
> "Black","White","White","White","White","Black","White","White","White","White",
> \
> >
> "Black","White","White","White","White","Black","White","White","White","White",
> \
> >
> "Black","White","White","White","White","Black","White","White","White","White",
> \
> >
> "Black","White","White","White","White","Black","White","White","White","White",
> \
> >
> "Black","White","White","White","White","Black","White","White","White","White",
> \
> >
> "Black","White","White","White","White","Black","White","White","White","White",
> \
> >
> "Black","White","White","white","White","Black","White","White","White","White",
> \
> > "Black"/) ; set contour lines colors
> > res1@cnMonoLineThickness = False ; turn off auto contour line thickness
> > res1@cnLineThicknesses = (/1.0,0.5,0.5,0.5,0.5,1.0,0.5,0.5,0.5,0.5, \
> > 1.0,0.5,0.5,0.5,0.5,1.0,0.5,0.5,0.5,0.5, \
> > 1.0,0.5,0.5,0.5,0.5,1.0,0.5,0.5,0.5,0.5, \
> > 1.0,0.5,0.5,0.5,0.5,1.0,0.5,0.5,0.5,0.5, \
> > 1.0,0.5,0.5,0.5,0.5,1.0,0.5,0.5,0.5,0.5, \
> > 1.0,0.5,0.5,0.5,0.5,1.0,0.5,0.5,0.5,0.5, \
> > 1.0,0.5,0.5,0.5,0.5,1.0,0.5,0.5,0.5,0.5, \
> > 1.0,0.5,0.5,0.5,0.5,1.0,0.5,0.5,0.5,0.5, \
> > 1.0,0.5,0.5,0.5,0.5,1.0,0.5,0.5,0.5,0.5, \
> > 1.0,0.5,0.5,0.5,0.5,1.0,0.5,0.5,0.5,0.5, \
> > 1.0/) ; set contour lines thickness
> >
> > res1@lbLabelsOn = True ; turn on the labels
> > ;res1@lbLabelAutoStride = False ; let NCL determine label spacing
> > res1@lbLeftMarginF = 0.001
> > res1@lbOrientation = "horizontal" ; label orientation
> > res1@lbBoxLinesOn = True ; turn on lines between labelbar colors
> > res1@lbLabelFont= "times-roman" ; font
> > res1@lbLabelFontHeightF= 0.005 ; set the label size
> > res1@lbLabelAlignment = "BoxCenters"
> > res1@pmLabelBarHeightF = 0.04
> > res1@lbLabelStride = 2 ; label every other box
> >
> >
> > res1@cnFillOn = True ; turn on color
> >
> >
> >
> >
> >
> >
> > ;---data for 2 metres temperature plot
> >
> > TEMP2M = gfs->tmp2m(:,:,:) ; temperature
> > NTIMES = dimsizes(gfs->time) ; number of times in the file
> > TEMP2M = TEMP2M - 273.15
> > TEMP2M@units = "(C)"
> > TEMP2M@long_name = "Temperatura a 2 metri dal suolo"
> > do it = 0,1 ;NTIMES-1
> > plot = gsn_csm_contour(wks,TEMP2M(it,:,:),res1)
> > overlay(map,plot)
> > draw(map)
> > frame(wks)
> > end do
> > do it = 0,1 ;NTIMES-1
> > if (it.le.8) then
> > system("mv temp.00000" + (it+1) + ".png" + " temperatura0" + (it) +
> "_" + systemfunc("date +%Y%m%d%H") + ".png")
> > end if
> > if (it.eq.9) then
> > system("mv temp.0000" + (it+1) + ".png" + " temperatura0" + (it) +
> "_" + systemfunc("date +%Y%m%d%H") + ".png")
> > end if
> > if (it.ge.10) then
> > system("mv temp.0000" + (it+1) + ".png" + " temperatura" + (it) + "_"
> + systemfunc("date +%Y%m%d%H") + ".png")
> > end if
> > end do
> > end
> >
>
> -------------- next part --------------
> An HTML attachment was scrubbed...
> URL:
> http://mailman.ucar.edu/pipermail/ncl-talk/attachments/20110921/f616cbe5/attachment.html
>
>
> ------------------------------
>
> _______________________________________________
> ncl-talk mailing list
> ncl-talk@ucar.edu <mailto:ncl-talk@ucar.edu>
> http://mailman.ucar.edu/mailman/listinfo/ncl-talk
>
>
> End of ncl-talk Digest, Vol 94, Issue 55
> ****************************************
>
>
>
>
> _______________________________________________
> ncl-talk mailing list
> List instructions, subscriber options, unsubscribe:
> http://mailman.ucar.edu/mailman/listinfo/ncl-talk
--
______________________________________________________________
Adam Phillips                                asphilli@ucar.edu
NCAR/Climate and Global Dynamics Division       (303) 497-1726
P.O. Box 3000
Boulder, CO 80307-3000    http://www.cgd.ucar.edu/cas/asphilli
_______________________________________________
ncl-talk mailing list
List instructions, subscriber options, unsubscribe:
http://mailman.ucar.edu/mailman/listinfo/ncl-talk
Received on Thu Sep 22 16:48:19 2011
This archive was generated by hypermail 2.1.8 : Thu Sep 22 2011 - 17:12:44 MDT