NCL Home>
Application examples>
Plot techniques ||
Data files for some examples
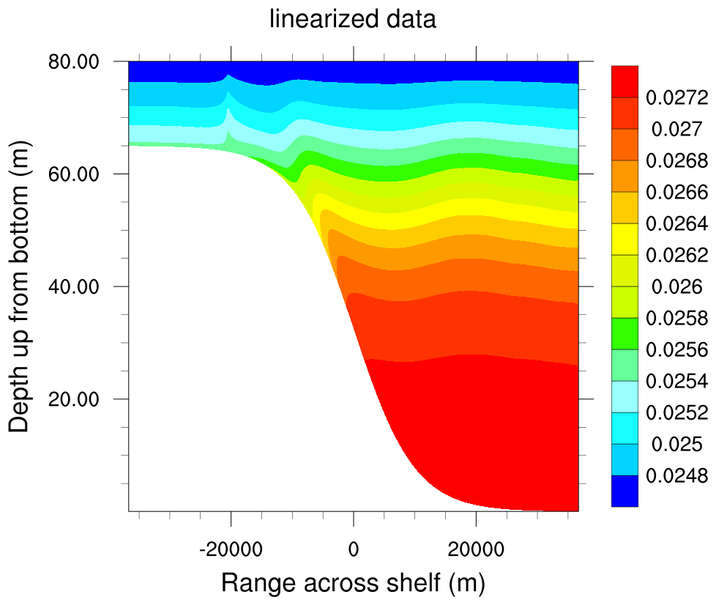
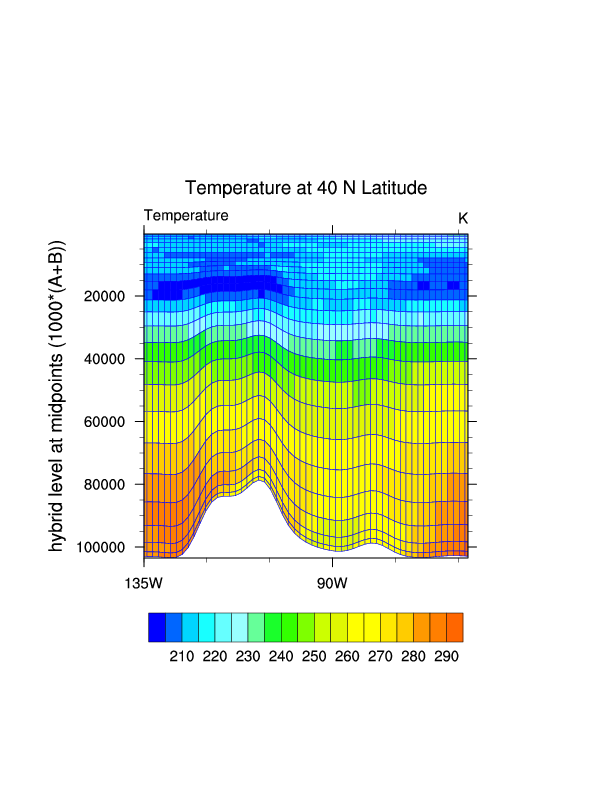
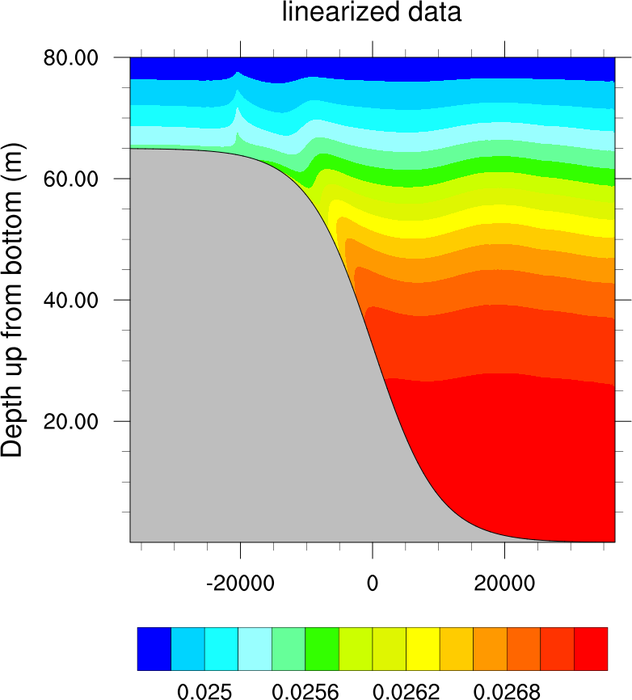
 2dvertcoords_1.ncl: The first
frame shows the data on the original grid. The second frame shows
the data linearized with a log-lin plot.
2dvertcoords_1.ncl: The first
frame shows the data on the original grid. The second frame shows
the data linearized with a log-lin plot.
 2dvertcoords_2.ncl: This
example shows how to generate a cell fill plot by setting
res@cnFillMode = "CellFill",
and outline the cell edges so that you can see the original grid that
the data are on.
2dvertcoords_2.ncl: This
example shows how to generate a cell fill plot by setting
res@cnFillMode = "CellFill",
and outline the cell edges so that you can see the original grid that
the data are on.
 2dvertcoords_3.ncl: This
example is similar to the second frame in the first example, except
it shows how to fill the area under the terrain in gray.
2dvertcoords_3.ncl: This
example is similar to the second frame in the first example, except
it shows how to fill the area under the terrain in gray.
Example pages containing: tips | resources | functions/procedures
Data with 2D vertical coordinates
The examples on this page can also be used for terrain-following plots.
This usually involves 2D arrays that represent the X,Y locations
of your data.
 2dvertcoords_1.ncl: The first
frame shows the data on the original grid. The second frame shows
the data linearized with a log-lin plot.
2dvertcoords_1.ncl: The first
frame shows the data on the original grid. The second frame shows
the data linearized with a log-lin plot.
 2dvertcoords_2.ncl: This
example shows how to generate a cell fill plot by setting
res@cnFillMode = "CellFill",
and outline the cell edges so that you can see the original grid that
the data are on.
2dvertcoords_2.ncl: This
example shows how to generate a cell fill plot by setting
res@cnFillMode = "CellFill",
and outline the cell edges so that you can see the original grid that
the data are on.
 2dvertcoords_3.ncl: This
example is similar to the second frame in the first example, except
it shows how to fill the area under the terrain in gray.
2dvertcoords_3.ncl: This
example is similar to the second frame in the first example, except
it shows how to fill the area under the terrain in gray.
gsn_add_polygon is used to draw the filled gray area, and gsn_add_polyline is used to outline the terrain.