High-resolution coastlines
One way to get high-resolution coastlines in your NCL maps is by downloading and installing the multi-resolution coastline database RANGS (Regionally Accessible Nested Global Shorelines), developed by Rainer Feistel from Wessel and Smith's GSHHS (Global Self-consistent Hierarchical High-resolution Shoreline) database.Note: do not use the high-resolution database for global data, as you will get streaks across your plot. This database is intended only for regional data.
NCL also supports shapefiles, if you need to add map outlines that NCL doesn't have.
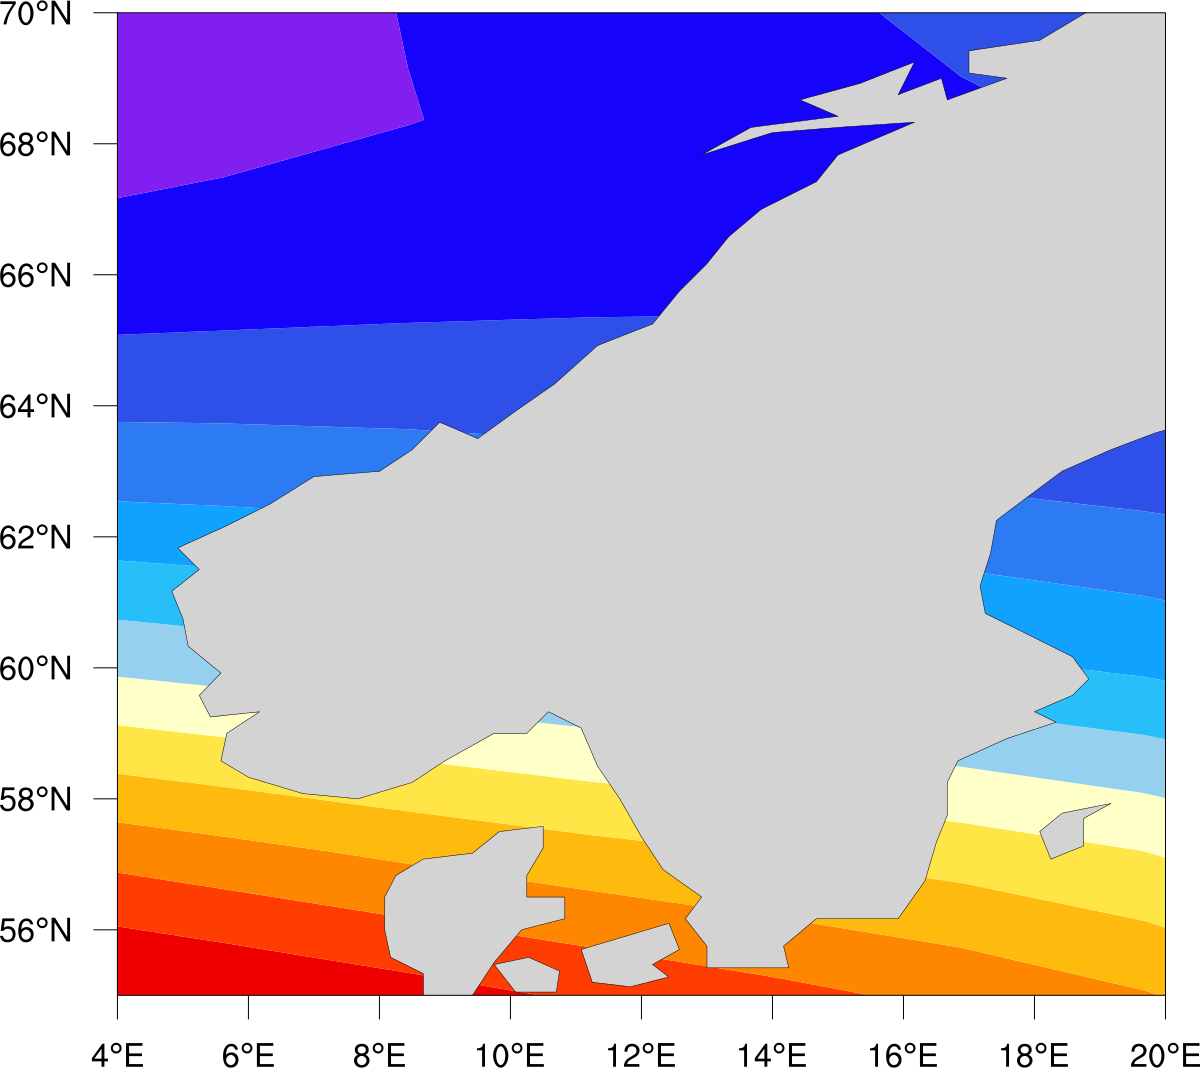
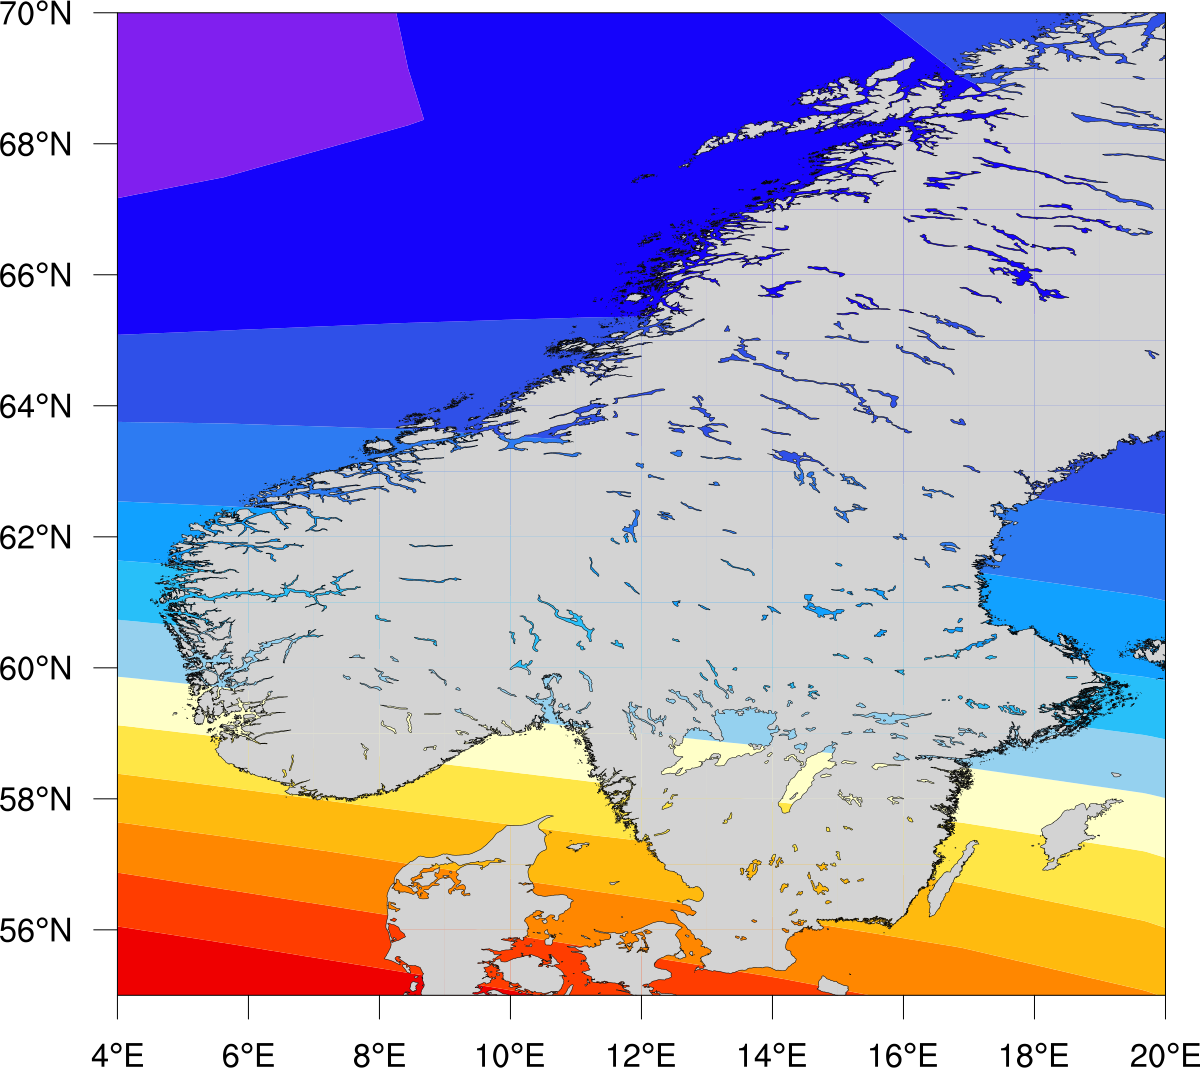
| Comparison of the three map resolutions available in NCL (map_resolutions.ncl) | ||
|---|---|---|
| Low resolution (current NCL default)
| Medium resolution
| High resolution (RANGS/GSSHS)
|

To use this database, you must first download it from: https://www.io-warnemuende.de/rangs-en.html. Oon this page you should see a table with ten *.zip files to download:
    rangs(0).zip     gshhs(0).zip
    rangs(1).zip     gshhs(1).zip
    rangs(2).zip     gshhs(2).zip
    rangs(3).zip     gshhs(3).zip
    rangs(4).zip     gshhs(4).zip
You must download all ten of these files, unzip them, and either put
them in the directory
$NCARG_ROOT/lib/ncarg/database/rangs
(which NCL will look in by default), or put them somewhere else and set the environment variable NCARG_RANGS to this directory. The files take up about 140 megabytes, unzipped.
Note that it is possible that after you unzip the files, the rangs(n).cat and rangs(n).cel files will get put in their own subdirectories. If this happens, you will need to move these files so they are in the same directory as the gshhs(n) files.
Once you have the files in the appropriate location, then in your NCL script, you can set the map resource mpDataBaseVersion to "HighRes" to create maps using this database. Note: you should not use this database to plot maximal area plots, because 1) you will get horizontal lines through your plot, and 2) it takes a long time.
Application Examples
Code Snippets
  res                      = True
  ...
  res@mpMaxLatF            = max(t&Latitude)   ; zoom in on region
  res@mpMinLatF            = min(t&Latitude)
  res@mpMinLonF            = min(t&Longitude)
  res@mpMaxLonF            = max(t&Longitude)
  res@mpDataBaseVersion    = "HighRes"
  plot = gsn_csm_contour_map(wks,t(0,:,:),res)