Example pages containing: tips | resources | functions/procedures
NCL: Binning Data: Satellite and Observations
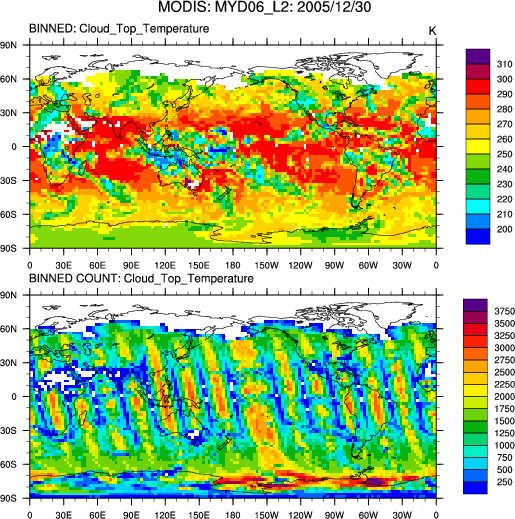 binning_1.ncl: Read multiple files
(here, 131 files) for one particular day; for each file
bin and sum the satellite data using bin_sum;
after all files have been read, use bin_avg
to average all the summed values; plot; create a netCDF
of the binned (gridded data).
binning_1.ncl: Read multiple files
(here, 131 files) for one particular day; for each file
bin and sum the satellite data using bin_sum;
after all files have been read, use bin_avg
to average all the summed values; plot; create a netCDF
of the binned (gridded data).
Note: here the data are netCDF files. However, the original files were HDF-SDS (Scientific Data Set) files. NCL can handle either. Only the file extension need be changed (.nc to .hdf).
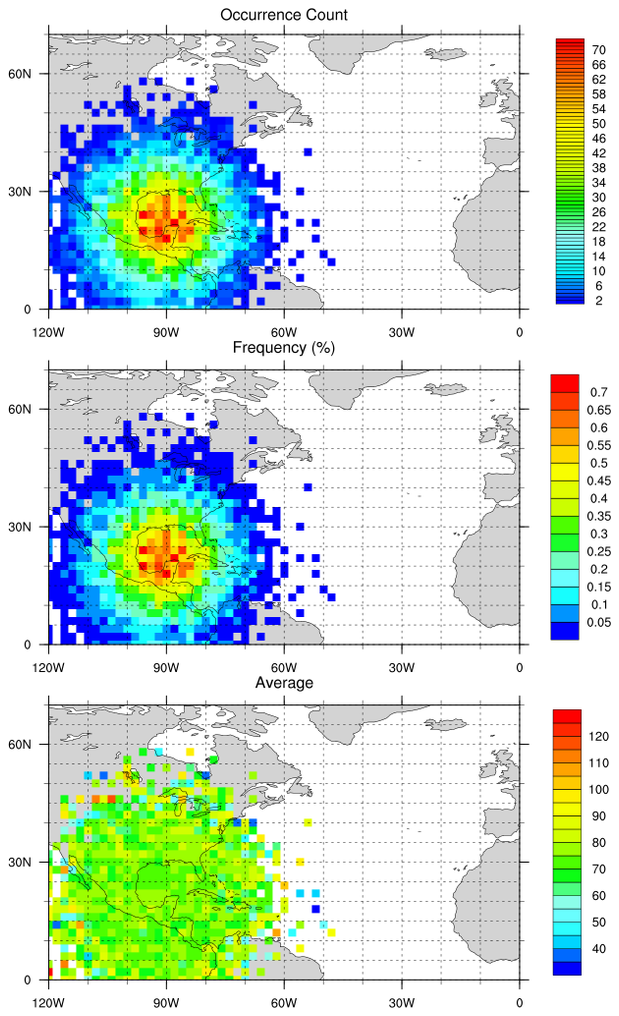 binning_2.ncl:
Consider a triplet ( clat[*], clon[*], cval[*] ) that represent
storm track positions and winds. Count the instances and frequency that these fall
within a particular grid box and the average wind values. These 'observations'
are all randomly generated and are presented for illustration
binning_2.ncl:
Consider a triplet ( clat[*], clon[*], cval[*] ) that represent
storm track positions and winds. Count the instances and frequency that these fall
within a particular grid box and the average wind values. These 'observations'
are all randomly generated and are presented for illustration
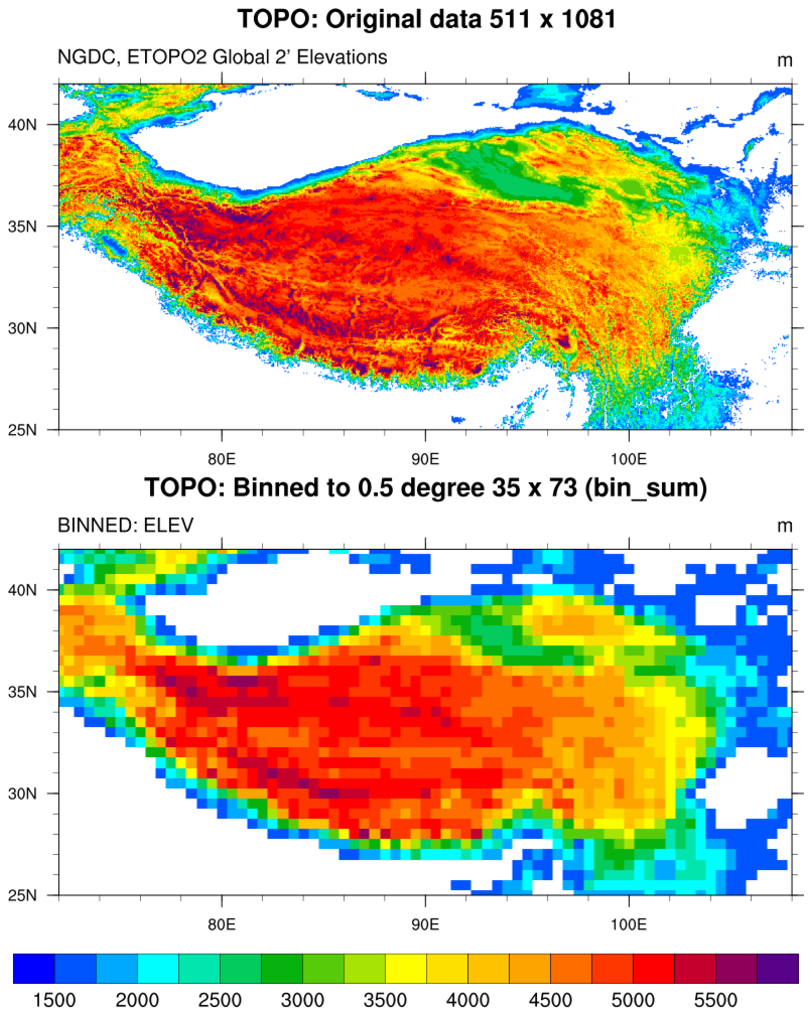 binning_3.ncl:
The input is a high resolution (511x1081) rectilinear grid with coordinate variables ( LAT and LON ).
The objective is to bin the data into a much lower resolution (35x73) grid.
binning_3.ncl:
The input is a high resolution (511x1081) rectilinear grid with coordinate variables ( LAT and LON ).
The objective is to bin the data into a much lower resolution (35x73) grid.
The bin_sum requires triplets (clat[*], clon[*], cval[*]) as input to the function. The function conform_dims can be used to create an array to conform to the data array. Then ndtooned can be used to create the needed triplets.