NCL Home>
Application examples>
Data Analysis ||
Data files for some examples
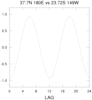 corel_1.ncl: Calculates a cross
correlation.
corel_1.ncl: Calculates a cross
correlation.
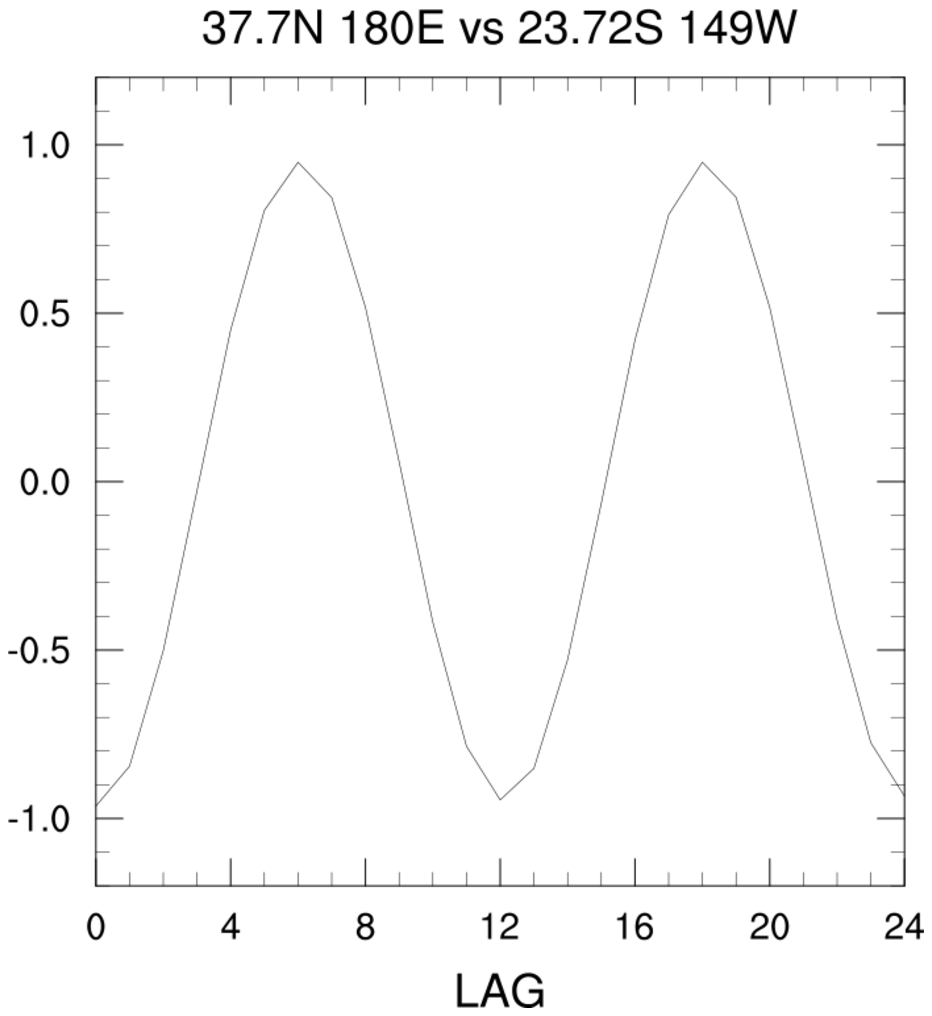
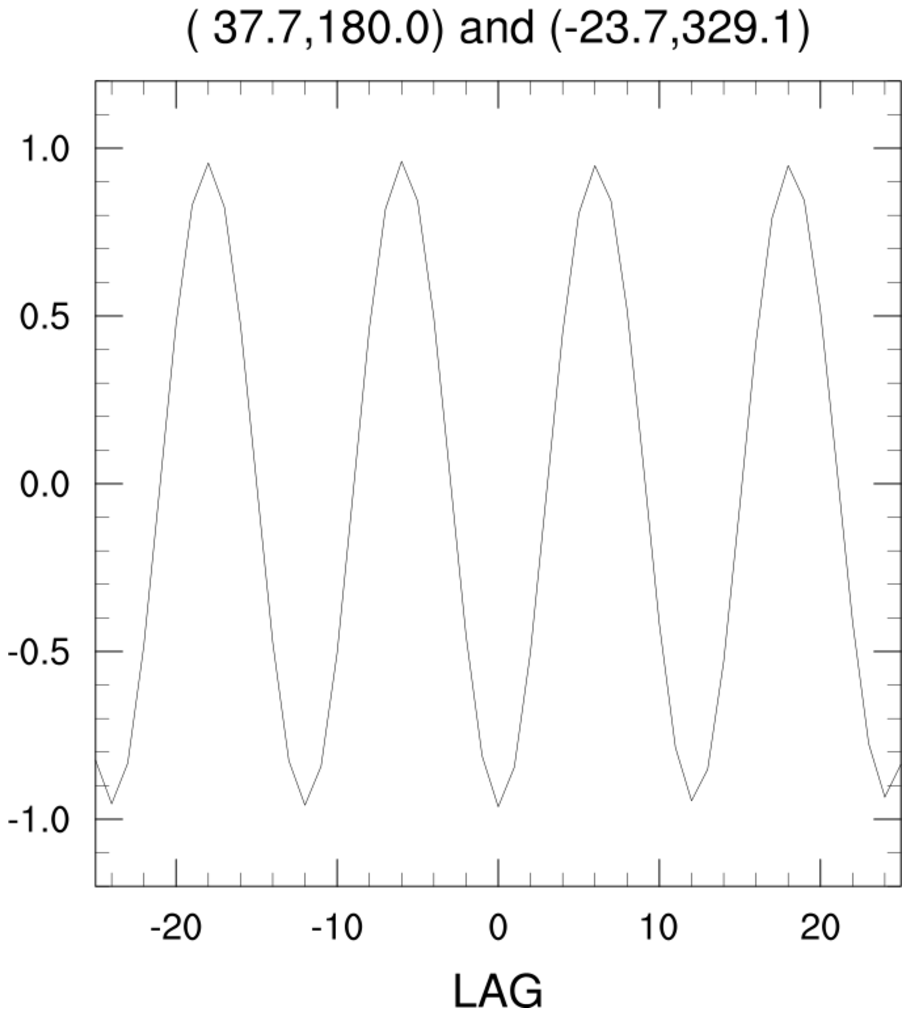
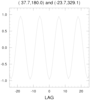 corel_2.ncl: The intrinsic NCL
correlation function
esccr only calculates the positive side of a
correlation. This script demonstrates how a pos and neg lag can be created.
NCL coordinate variable syntax [ {...} ] is used to specify locations.
NCL index syntax [ ::-1 ] is used to reverse the array order.
corel_2.ncl: The intrinsic NCL
correlation function
esccr only calculates the positive side of a
correlation. This script demonstrates how a pos and neg lag can be created.
NCL coordinate variable syntax [ {...} ] is used to specify locations.
NCL index syntax [ ::-1 ] is used to reverse the array order.
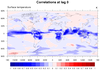 corel_3.ncl: Demonstrates using
the same functions to do a 2D correlation in time.
corel_3.ncl: Demonstrates using
the same functions to do a 2D correlation in time.

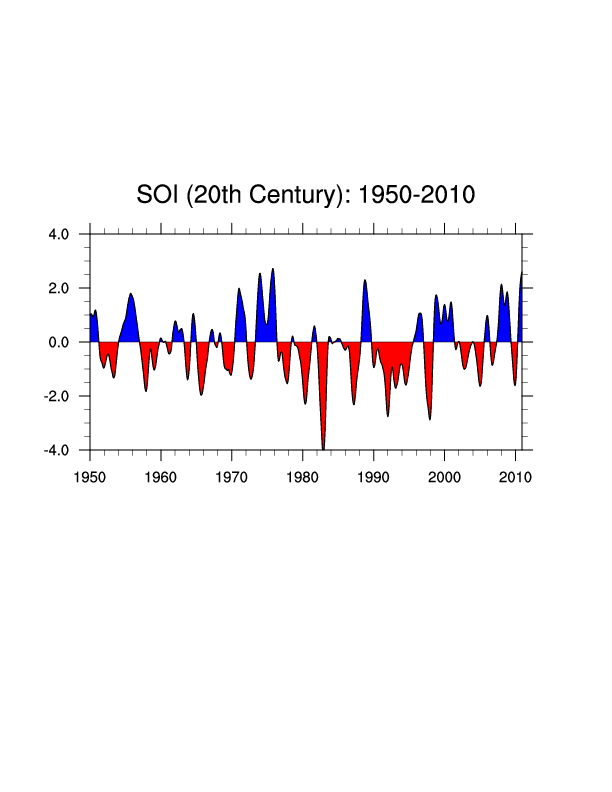
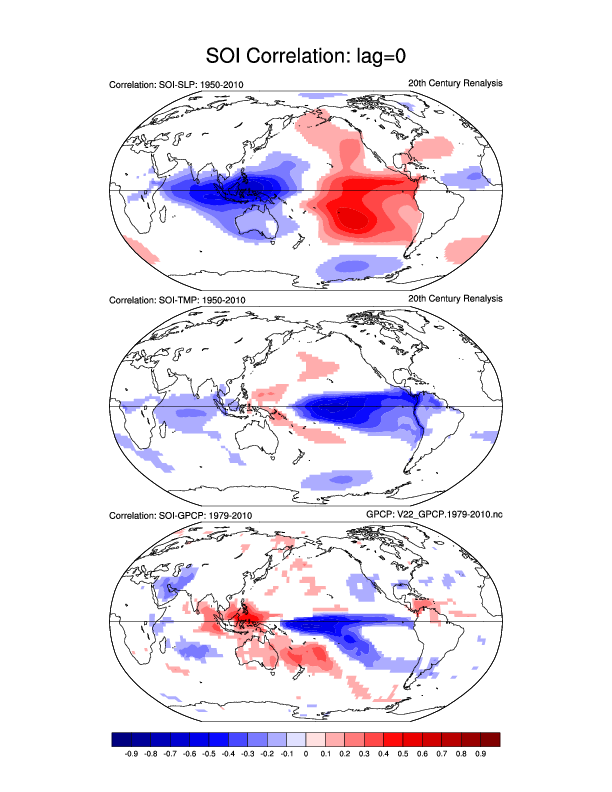
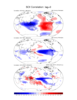 indices_soi_2.ncl:
Read gridded sea level pressure from the 20th Century Reanalysis; use proxy grid points
near Tahiti and Darwin to construct an SOI time series spanning 1950-2010;
perform lag-0 correlations between the SOI and SLP; SOI and temperature; and,
SOI and preciptation. The later uses the GPCP data which spans 1979-2010.
To more clearly delineate the main pattern structure correlations between,
-0.1 and +0.1 were set to _FillValue.
indices_soi_2.ncl:
Read gridded sea level pressure from the 20th Century Reanalysis; use proxy grid points
near Tahiti and Darwin to construct an SOI time series spanning 1950-2010;
perform lag-0 correlations between the SOI and SLP; SOI and temperature; and,
SOI and preciptation. The later uses the GPCP data which spans 1979-2010.
To more clearly delineate the main pattern structure correlations between,
-0.1 and +0.1 were set to _FillValue.
Example pages containing: tips | resources | functions/procedures
NCL: Correlations
In addition to the functions demonstrated on this page, there are
two more that might be of interest:
esacr computes an auto correlation and
escorc computes an cross correlation at zero lag
 corel_1.ncl: Calculates a cross
correlation.
corel_1.ncl: Calculates a cross
correlation.
esccr: Calculates the cross correlation between two variables.
dimsizes: Calculates the size of the dimensions
of a variable.
 corel_2.ncl: The intrinsic NCL
correlation function
esccr only calculates the positive side of a
correlation. This script demonstrates how a pos and neg lag can be created.
NCL coordinate variable syntax [ {...} ] is used to specify locations.
NCL index syntax [ ::-1 ] is used to reverse the array order.
corel_2.ncl: The intrinsic NCL
correlation function
esccr only calculates the positive side of a
correlation. This script demonstrates how a pos and neg lag can be created.
NCL coordinate variable syntax [ {...} ] is used to specify locations.
NCL index syntax [ ::-1 ] is used to reverse the array order.
 corel_3.ncl: Demonstrates using
the same functions to do a 2D correlation in time.
corel_3.ncl: Demonstrates using
the same functions to do a 2D correlation in time.
The data must be reordered to put time as the rightmost dimension.
This example computes the cross-correlation at lags 0,1 and 2. If the cross-correlation at 0-lag only were desired, then it would be more efficient to use escorc.
Since the correlation values will always span -1 to 1, the two end labelbar boxes representing values above 1 and below -1 were removed by setting res@cnLabelBarEndStyle to "ExcludeOuterBoxes".
 indices_soi_2.ncl:
Read gridded sea level pressure from the 20th Century Reanalysis; use proxy grid points
near Tahiti and Darwin to construct an SOI time series spanning 1950-2010;
perform lag-0 correlations between the SOI and SLP; SOI and temperature; and,
SOI and preciptation. The later uses the GPCP data which spans 1979-2010.
To more clearly delineate the main pattern structure correlations between,
-0.1 and +0.1 were set to _FillValue.
indices_soi_2.ncl:
Read gridded sea level pressure from the 20th Century Reanalysis; use proxy grid points
near Tahiti and Darwin to construct an SOI time series spanning 1950-2010;
perform lag-0 correlations between the SOI and SLP; SOI and temperature; and,
SOI and preciptation. The later uses the GPCP data which spans 1979-2010.
To more clearly delineate the main pattern structure correlations between,
-0.1 and +0.1 were set to _FillValue.
FYI: The linear correlation between the station based SOI (previous example) and the SOI derived from the 20th Century Reanalysis for the 1950-2010 period is 0.96.