The template and examples for this series of plots were written by Dr. Jason Evans, an ARC Australian Research Fellow at the Climate Change Research Center, University of New South Wales, Sydney, Australia.
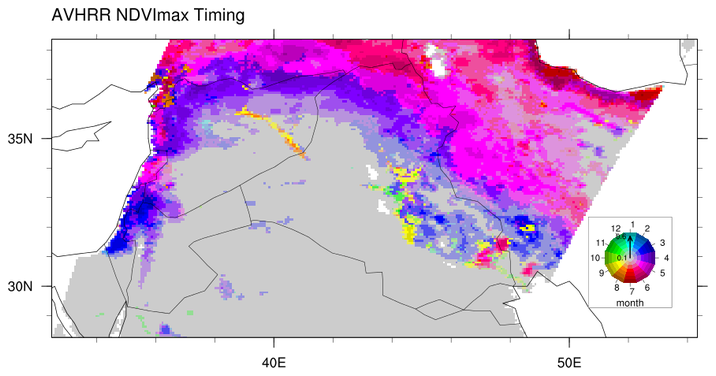
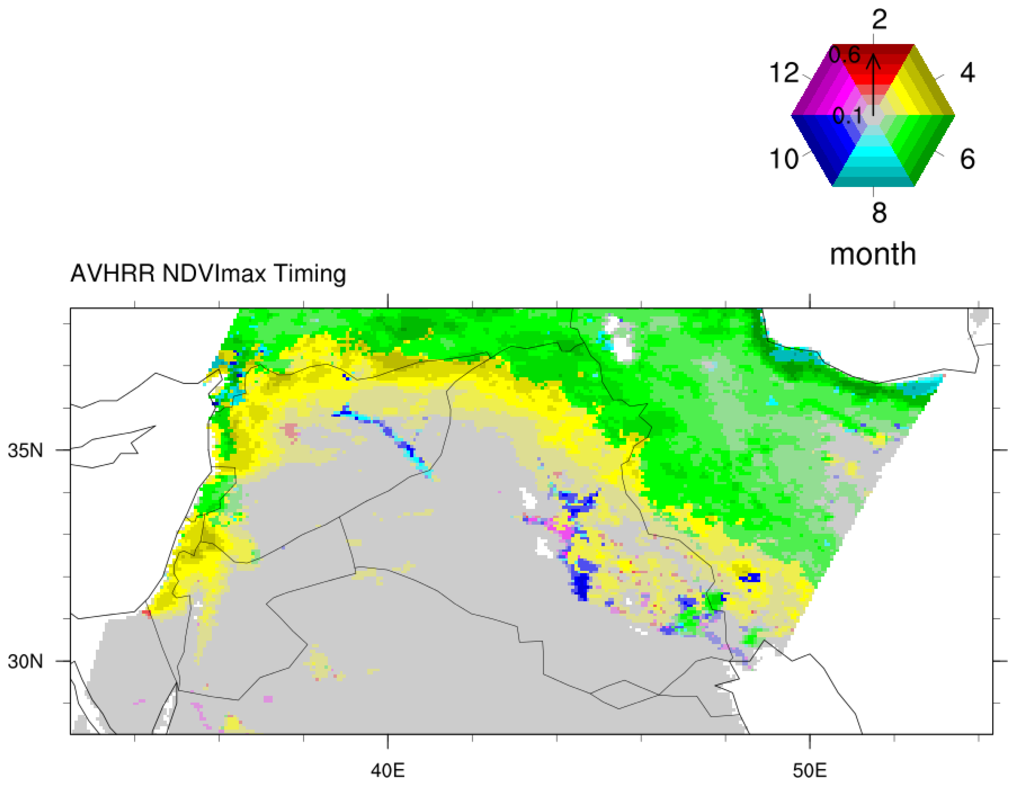
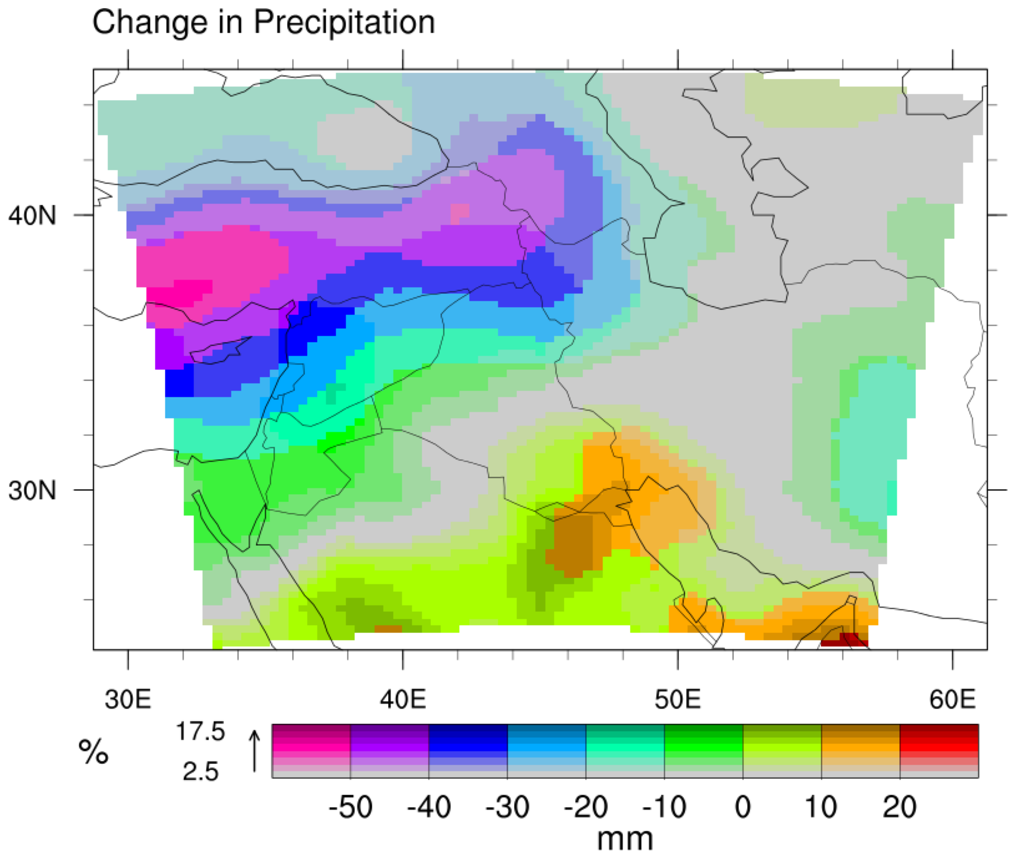
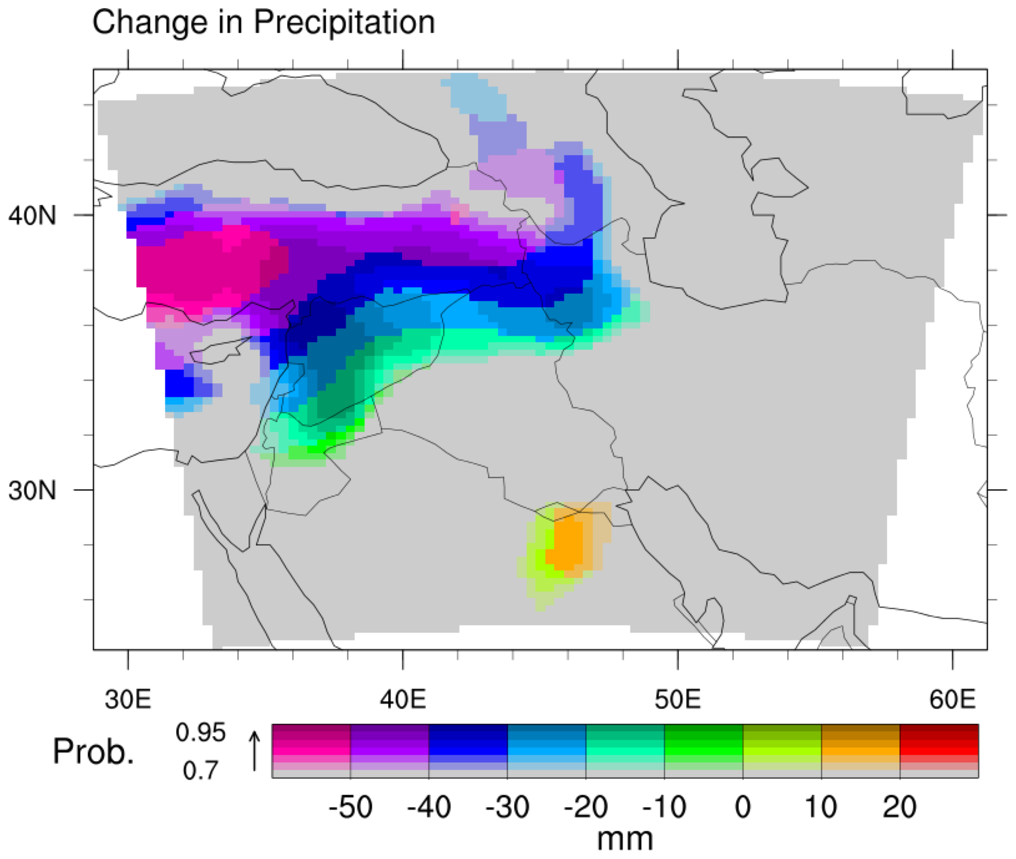
Jason has created a template that makes plotting Evans plots easy. In order to use the template you need to download and load the evans_plot.ncl script, and the gcm_co2_pre.nc, ndvi_time.nc and/or pr_mme_change_sresa2.nc files.
The Evans plot function is called using:
evans_plot_map(
               wks:graphic,              ; pre-created workstation object
               hue_data[*][*]:numeric,   ; 2D color data
               sat_data[*][*]:numeric,   ; 2D saturation data
               resources:logical)        ; optional resources
Two other functions can be called to plot a label bar or color wheel on their own. This is useful when paneling evans plots.
add_ep_label_bar_ndc(
                     wks:graphic,        ; pre-created workstation object
                     resources:logical   ; optional resources
                    )

add_ep_color_wheel_bar_ndc(
                           wks:graphic,       ; pre-created workstation object
                           resources:logical  ; optional resources
                         )
There are several resources to modify an Evans plot, all of which are
passed to the evans_plot function as attributes of the resources
logical variable (resources which only apply to Evans plots begin with
ep). Below, the type of the attribute is given in { } while the
default value is given in [ ]:
- epCyclic {logical} ; is the hue variable cyclic? [True]
- epHueLabel {string} ; to label the hues [hue_data@units]
- epSatLabel {string} ; to label the saturations [sat_data@units]
- epExplicitSatLevels {float[*]} ; user set saturation levels
- epMaxSatLevel {float} ; max saturation level
- epMinSatLevel {float} ; min saturation level
- epSatLevelSpacing {float} ; saturation level spacing
- epExplicitHueLevels {float[*]} ; user set hue levels
- epMaxHueLevel {float} ; max hue level
- epMinHueLevel {float} ; min hue level
- epHueLevelSpacing {float} ; hue level spacing
- epMinIntensity {float} ; minimum intensity to use (0-1) [0.8]
- epColorWheelScale {float} ; change the size of the color wheel by multiplying by this scale factor [1.]
- epColorWheelCenterX {float} ; center X of color wheel in ndc [0.85]
- epMinSat {float} : minimum saturation to use (0-1) [0.]
- epNumMaxSat {integer} : number of saturation levels to be fully saturated and distinguished by changes in intensity [1 if <6 sat levels, 4 otherwise]
- epReverseSatColors {logical} : reverse the order of the saturations [False] causes grey to be the largest values
- epColorBarOn {logical} ; Display the color bar? [true]
- epColorWheelScale {float} ; change the size of the color wheel by multiplying by this scale factor [1.]
- epColorWheelCenterX {float} ; center X of color wheel in ndc [0.85]
- epColorWheelCenterY {float} ; center Y of color wheel in ndc [0.85]
- epColorWheelPerimOn {logical} ; draw a box around the color wheel? [False]
- epHueOffset {float} ; make the first hue this many degrees around the color wheel from red (0-360) [0.]
- epHueFontSize {float} : Font size for the hue numbers. Is also scaled by epColorWheelScale [0.018]
- epSatFontSize {float} : Font size for the sat numbers. Is also scaled by epColorWheelScale [0.015]
