NCL Home>
Application examples>
Plot techniques

 font_1.ncl:Demonstrates how to
change the font size of the
gsnLeftString,
gsnRightString, and
gsnCenterString.
font_1.ncl:Demonstrates how to
change the font size of the
gsnLeftString,
gsnRightString, and
gsnCenterString.
 font_2.ncl:Demonstrates how to
blow up the lat/lon labels on a polar plot. Unlike other plot templates,
the lat/long labels on a polar plot are not part of a tickmark object,
but instead they are text features that have been manually added to the
plot.
font_2.ncl:Demonstrates how to
blow up the lat/lon labels on a polar plot. Unlike other plot templates,
the lat/long labels on a polar plot are not part of a tickmark object,
but instead they are text features that have been manually added to the
plot.

 font_3.ncl: Demonstrates enlarging
tickmark labels. Note that Mary Haley automatically resizes the label
bar labels to be the same size as the tick mark labels.
font_3.ncl: Demonstrates enlarging
tickmark labels. Note that Mary Haley automatically resizes the label
bar labels to be the same size as the tick mark labels.

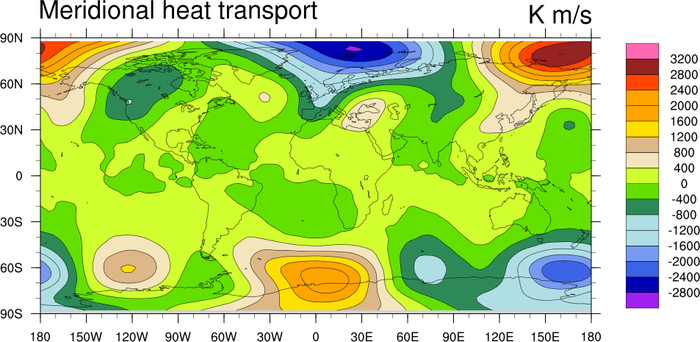
 font_4.ncl: Demonstrates enlarging
label bar labels.
font_4.ncl: Demonstrates enlarging
label bar labels.
 font_6.ncl: Demonstrates contour
line labels and the contour information label.
font_6.ncl: Demonstrates contour
line labels and the contour information label.
NCL Graphics: Font Heights
Many of the font heights of the labels we use in our graphics are
controlled by separate resources. We will demonstrate them here.
Additionally, in the gsn_csm
plot interfaces, the label font heights are adjusted so that they
will be consistent with each other. Thus, if you change the font
height of one label, you may find that other labels change as
well.

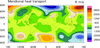
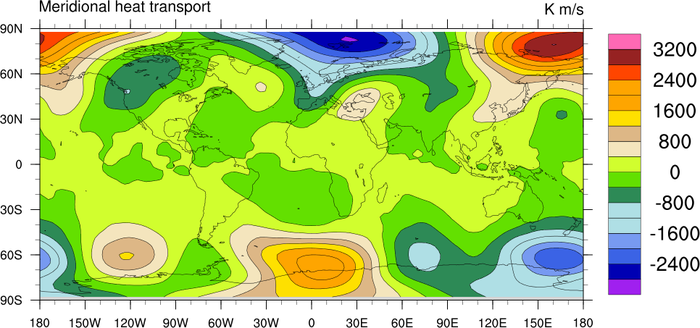
 font_1.ncl:Demonstrates how to
change the font size of the
gsnLeftString,
gsnRightString, and
gsnCenterString.
font_1.ncl:Demonstrates how to
change the font size of the
gsnLeftString,
gsnRightString, and
gsnCenterString.
gsnStringFontHeightF changes the font height of all the labels simultaneously, while gsnLeftStringFontHeightF, gsnRightStringFontHeightF, and gsnCenterStringFontHeightF adjust individual strings.
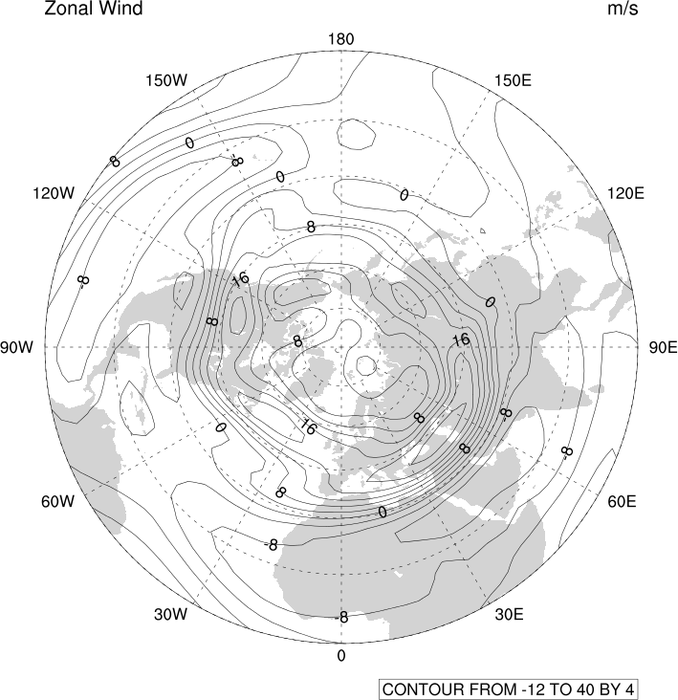
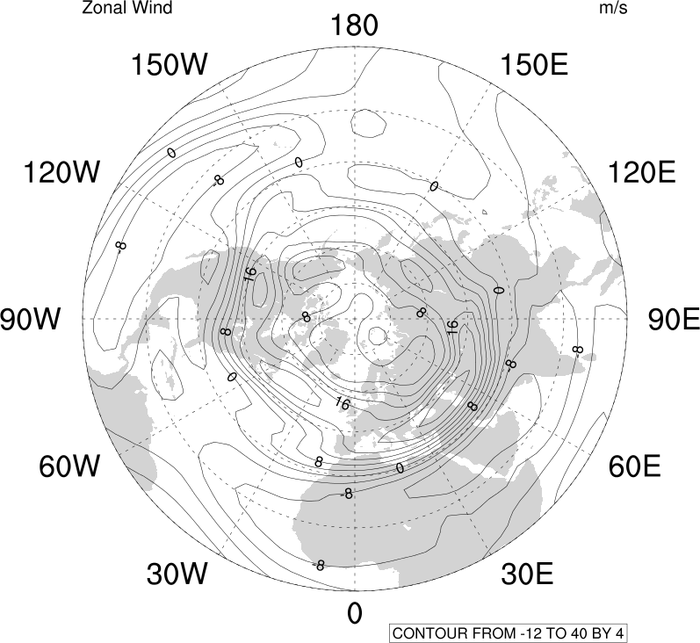 font_2.ncl:Demonstrates how to
blow up the lat/lon labels on a polar plot. Unlike other plot templates,
the lat/long labels on a polar plot are not part of a tickmark object,
but instead they are text features that have been manually added to the
plot.
font_2.ncl:Demonstrates how to
blow up the lat/lon labels on a polar plot. Unlike other plot templates,
the lat/long labels on a polar plot are not part of a tickmark object,
but instead they are text features that have been manually added to the
plot.
gsnPolarLabelFontHeightF= .025 changes the font height of the lat/long labels w/o changing the gsn* string text.
gsnPolarLabelDistance = 1.08 controls how far away from the circle the polar labels will be drawn. These labels are not a tick mark object. They are are text that has been manually added. A determination was made as to how far away from the edge to place this text. When the ability to blow the text up was added, it ran the 0 and 180 text into the circle. Note that this resource moves all the text out, and not just the 0 and 180.
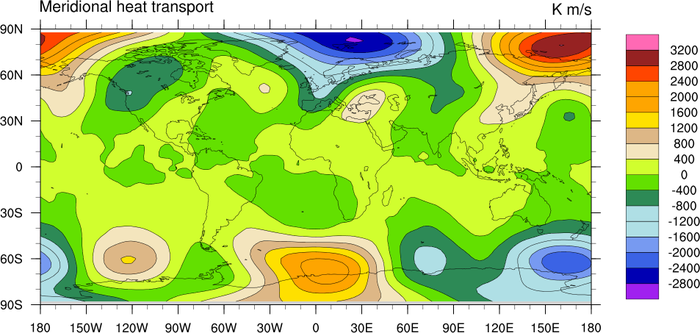
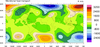
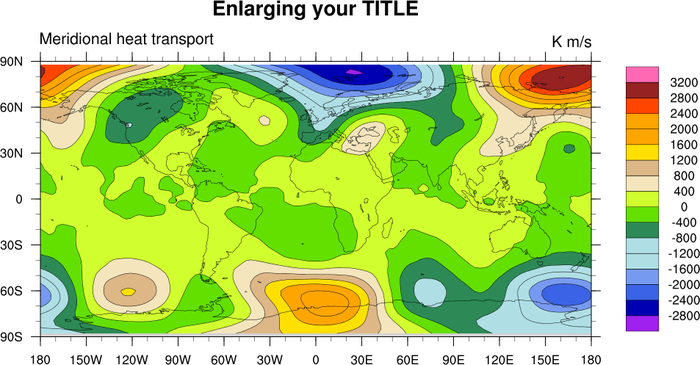
 font_3.ncl: Demonstrates enlarging
tickmark labels. Note that Mary Haley automatically resizes the label
bar labels to be the same size as the tick mark labels.
font_3.ncl: Demonstrates enlarging
tickmark labels. Note that Mary Haley automatically resizes the label
bar labels to be the same size as the tick mark labels.
tmXBLabelFontHeightF = 0.014
tmYLLabelFontHeightF = 0.014
will increase the x-bottom and y-left tick marks respectively.
tmXBTickSpacingF = 60.

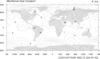
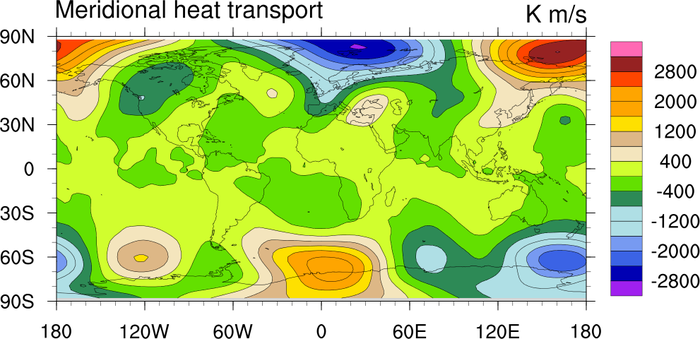
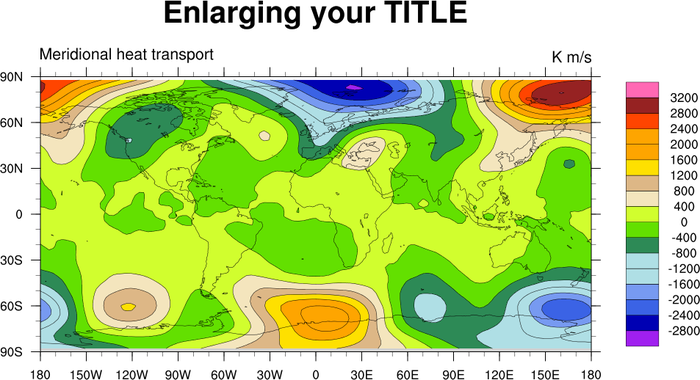
 font_4.ncl: Demonstrates enlarging
label bar labels.
font_4.ncl: Demonstrates enlarging
label bar labels.
lbLabelFontHeightF, will enlarge label bar labels.
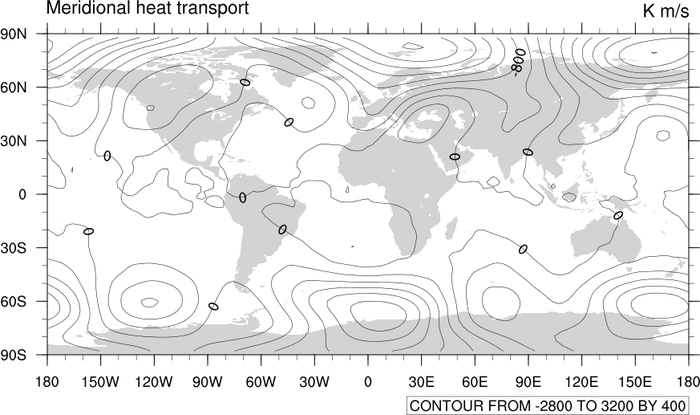
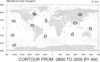
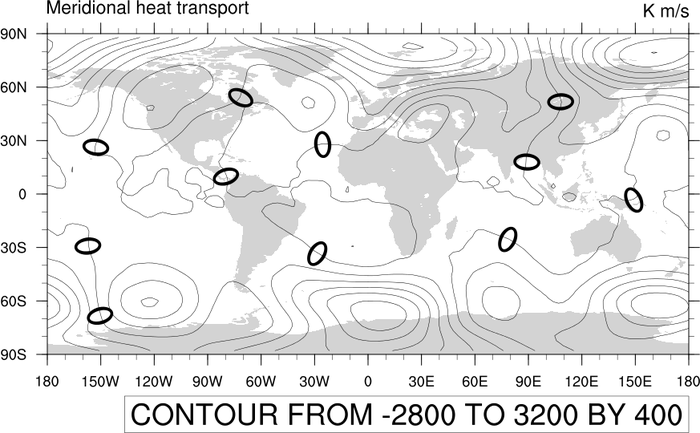 font_6.ncl: Demonstrates contour
line labels and the contour information label.
font_6.ncl: Demonstrates contour
line labels and the contour information label.
cnLineLabelFontHeightF and cnInfoLabelFontHeightF are the resources you need.