NCL Home>
Application examples>
Data sets ||
Data files for some examples
Example pages containing:
tips |
resources |
functions/procedures
NCL: GOES - Geostationary Operational Environmental Satellites
The National Weather Service (NWS) uses the GOES system for its United
States weather monitoring and forecasting operations, and scientific
researchers use the data to better understand land, atmosphere, ocean,
and climate interactions.
The GOES system uses geosynchronous satellites which—since the launch
of SMS-1 in 1974—have been a basic element of U.S. weather monitoring
and forecasting.
GOES satellites are currently available for operational use:
    1) GOES-12 is designated GOES-South, currently located at 60°W
    2) GOES-13 is designated GOES-East, currently located at 75°W.
       It provides most of the U.S. weather information.
       In 12/2017 GOES-13 will be placed in a storage (graveyard) orbit at 60 degrees west longitude.
    3) GOES 14 was placed in orbit on 7 July 2009, underwent Post-Launch Testing
       until December 2009 and then was placed in on-orbit storage at 105° W.
    4) GOES 15 is designated GOES-West, currently located at 135°W over the Pacific Ocean.
    5) GOES 16 replaces GOES-13 (12/2017) and is designated GOES-East (75.2°W).
    6) GOES-17 will be designated GOES-S upon reaching geostationary orbit.
FYI: The GOES-East position was chosen primarily because it
offers full coverage of the continental United States and provides
optimal viewing of the states and cities in the plains, mid-west and
east most impacted by severe weather events including Atlantic
Hurricanes, thunderstorms and tornadoes, major winter storms, and
flooding.
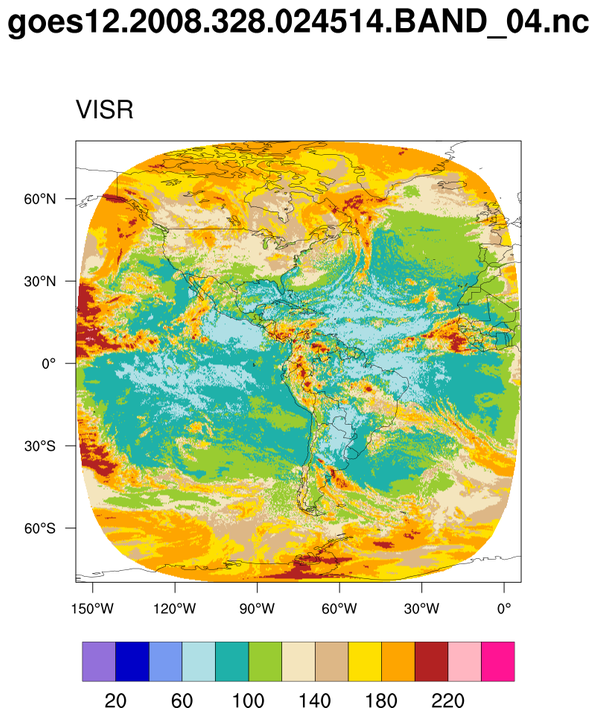
 goes_2.ncl
:
A GOES-12 plot. The script handles bogus values by assigning
outliers to an _FillValue attribute. Since the lat/lon have
missing values, you must set
res@
trGridType to
"TriangularMesh".
The file has issues. Specifically, the lat and lon have
bogus values:
(0)    min(lat)=-79.7354   max(lat)=2.14329e+09  <===
(0)    min(lon)=-156.169   max(lon)=2.14329e+09  <===

%> ncdump -v lat,lon goes12.2008.328.024514.BAND_04.nc | less

        float data(time, yc, xc) ;
                data:long_name = "0-255 Brightness Temperature" ;
                data:type = "VISR" ;
                data:coordinates = "lon lat" ;
        float lat(yc, xc) ;
                lat:long_name = "lat" ;
                lat:units = "degrees_north" ;
        float lon(yc, xc) ;
                lon:long_name = "lon" ;
                lon:units = "degrees_east" ;
There is no indication of a '_FillValue' or' missing_value' attribute
for lat, lon or data.
The data variable should have (we think):
data@_FillValue = 255
 goes_3.ncl
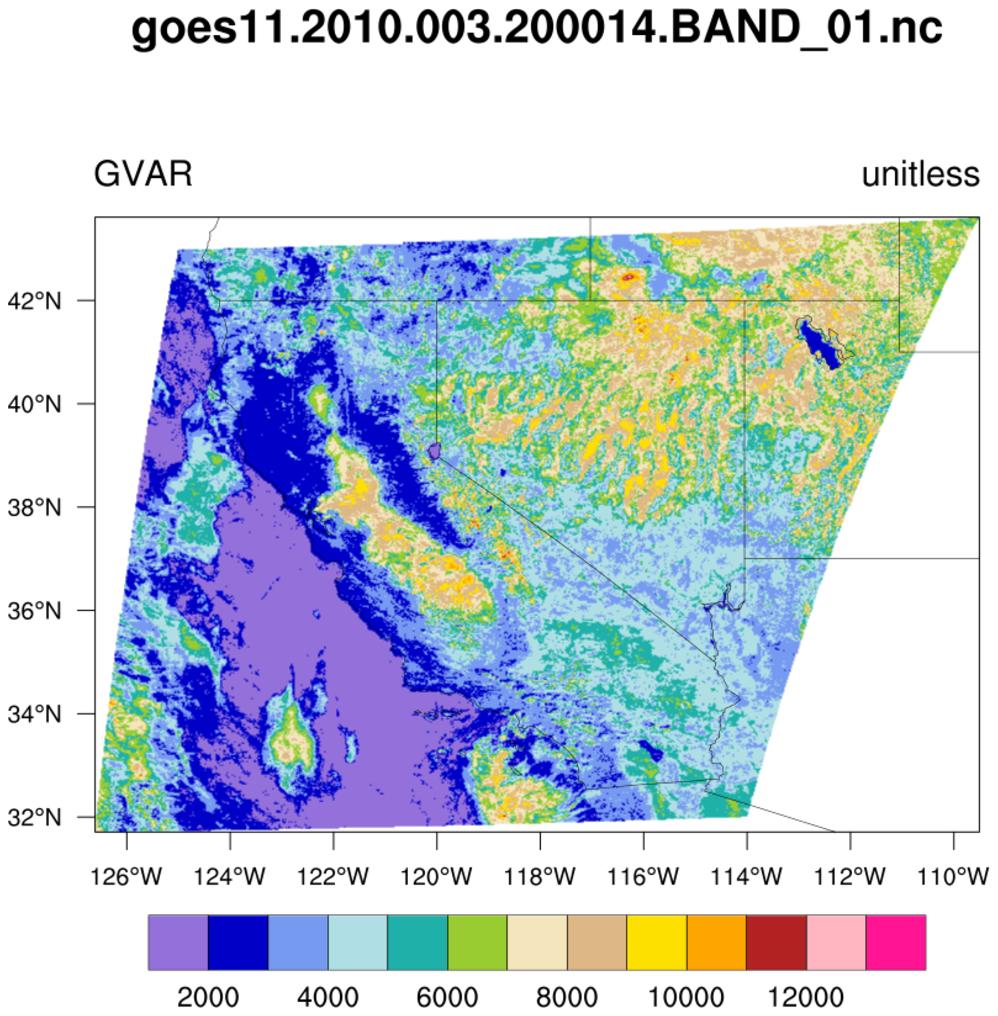
:
Plotting data from GOES-15t. The lat/lon data has the same issues as the GOES-12 plot
above.
Additionally, the longitude values cross the dateline, so we fix
these values by adding 360. Finally, to speed up plotting, we only
plot every 10th value.
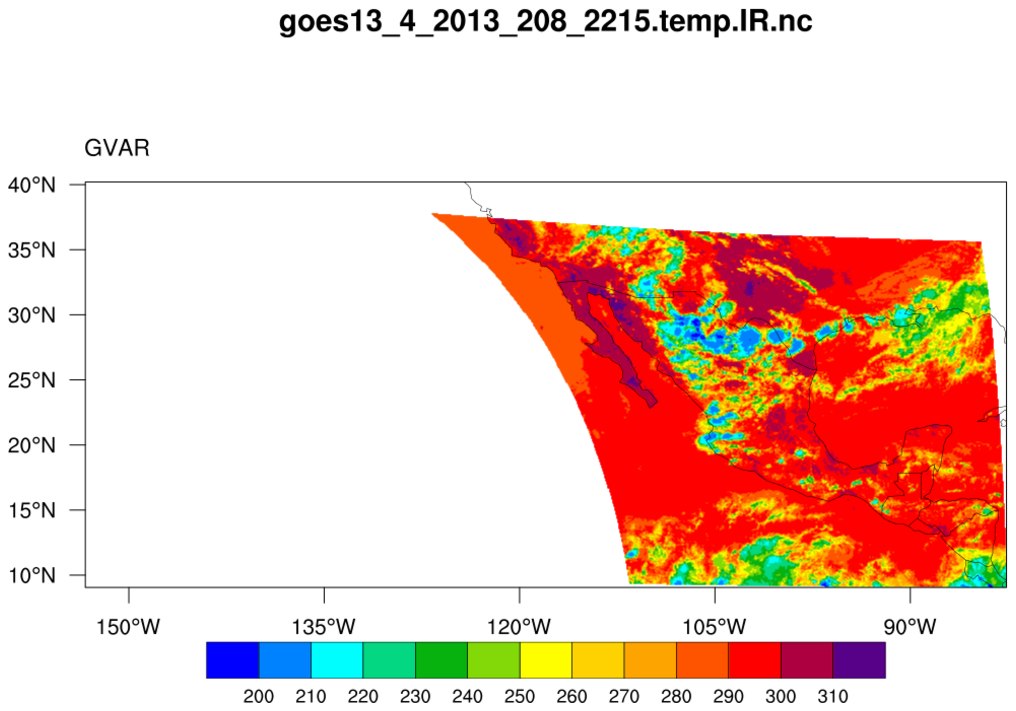
 goes_4.ncl
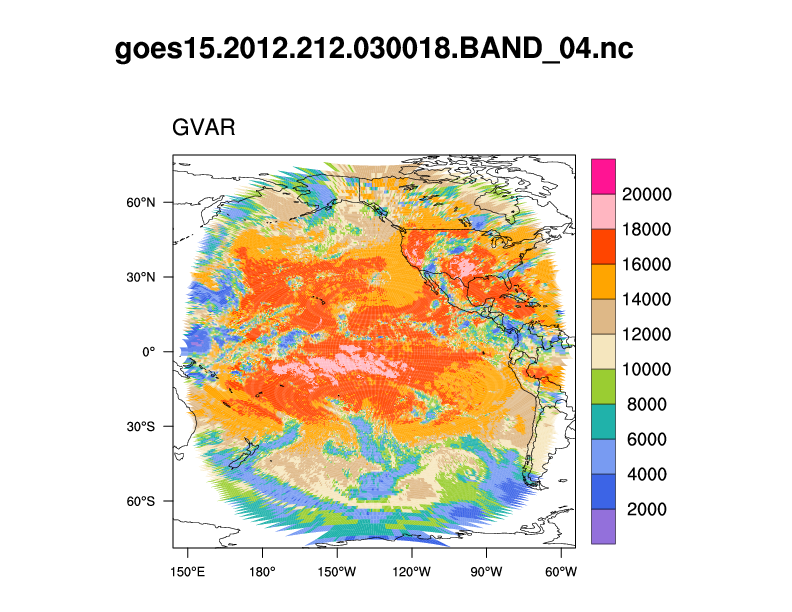
:
Another GOES-12 plot for a very small region.
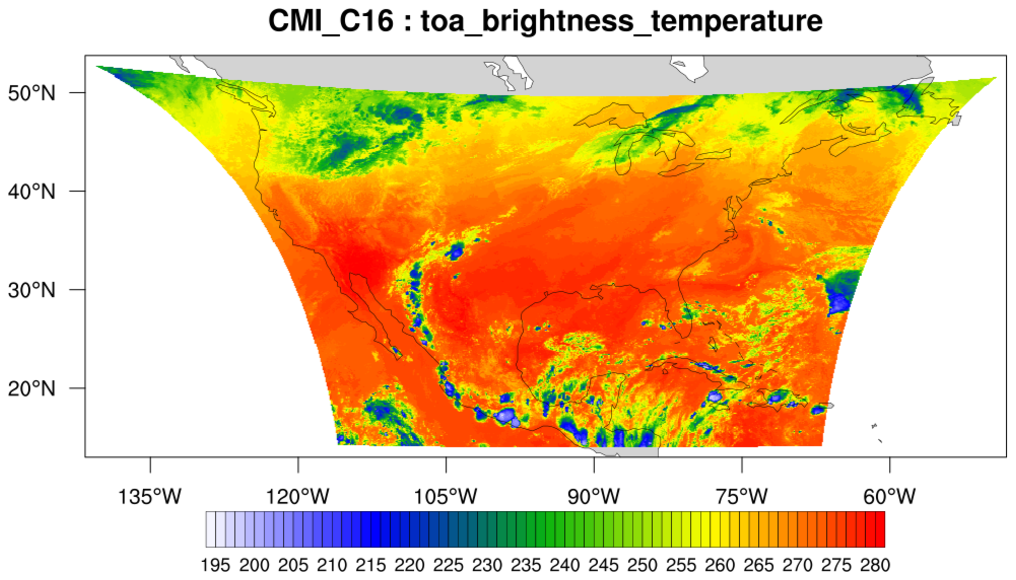
 goes_6.ncl
: Plotting data from GOES-16.
This script requires
goesYXtoLatLon.ncl, which
contains the function for calculating lat/lon values.
As with previous GOES data, the lat/lon can contain missing values, so
you must plot this data setting res@trGridType
to "TriangularMesh".
The 2D data is 1500 x 2500. Out of curiosity, timimgs were inserted in
the script to keep track of how long the script takes for various
sections:
  =====> CPU Elapsed Time: getting data: 1.06084 seconds <=====
  =====> CPU Elapsed Time: graphics: 20.7621 seconds <=====
  =====> CPU Elapsed Time: full script: 21.9095 seconds <=====