The monthly GPCP has become the standard against which climate model output is evaluated. It is available in netCDF or binary format.
NCL Home>
Application examples>
Data sets ||
Data files for some examples
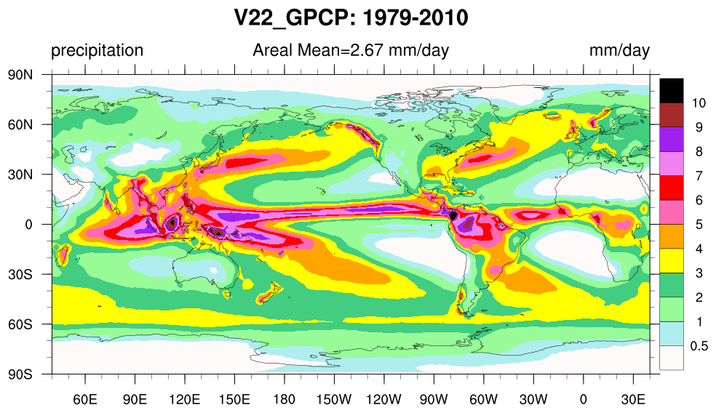
 gpcp_2.ncl:
Create a time series of global monthly mean precipitation rates and
a zonal mean plot of precipitation rates.
gpcp_2.ncl:
Create a time series of global monthly mean precipitation rates and
a zonal mean plot of precipitation rates.
 gpcp_3.ncl:
Using the GPCP-1DD data calculate the raw and smoothed daily mean annual cycle
within a user specified region. In this example, the region is the Nino 3.4 region.
gpcp_3.ncl:
Using the GPCP-1DD data calculate the raw and smoothed daily mean annual cycle
within a user specified region. In this example, the region is the Nino 3.4 region.
Example pages containing:
tips |
resources |
functions/procedures
NCL: GPCP: Global Precipitation Climatology Project
Data from rain gauge stations, satellites, and sounding observations have been merged to estimate monthly rainfall on a 2.5-degree global grid from 1979 to the present. The careful combination of satellite-based rainfall estimates provides the most complete analysis of rainfall available to date over the global oceans, and adds necessary spatial detail to the rainfall analyses over land. In addition to the combination of these data sets, estimates of the uncertainties in the rainfall analysis are provided as a part of the GPCP products. The August 2012 GPCP v2.2 uses upgraded emission and scattering algorithms, the GPCC precipitation gauge analysis, and inclusion of the DMSP F17 SSMIS.
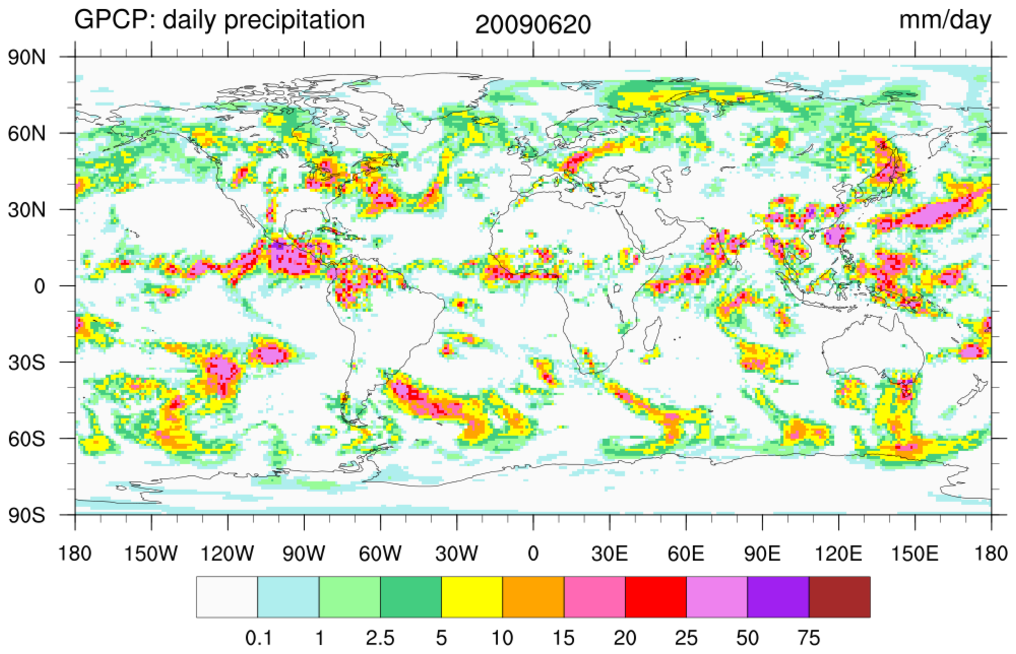
The GPCP 1DD product provides precipitation estimates on a 1-degree grid over the entire globe at 1-day (daily) for the period October 1996 - present. Both the Pentad and 1DD products are consistent with the Version 2 monthly product in the sense that the Pentad and 1DD approximately sum to the monthly SG estimate. All three precipitation products are produced by optimally merging estimates computed from microwave, infrared, and sounder data observed by the international constellation of precipitation-related satellites, and precipitation gauge analyses.
The 1DD product is available in binary format only. An NCL script that reads the binary data files and creates netCDF is availble here.
Please also see the Climate Analysis Section's Climate Data Guide for further information
on the monthly and daily GPCP products. Search for GPCP.
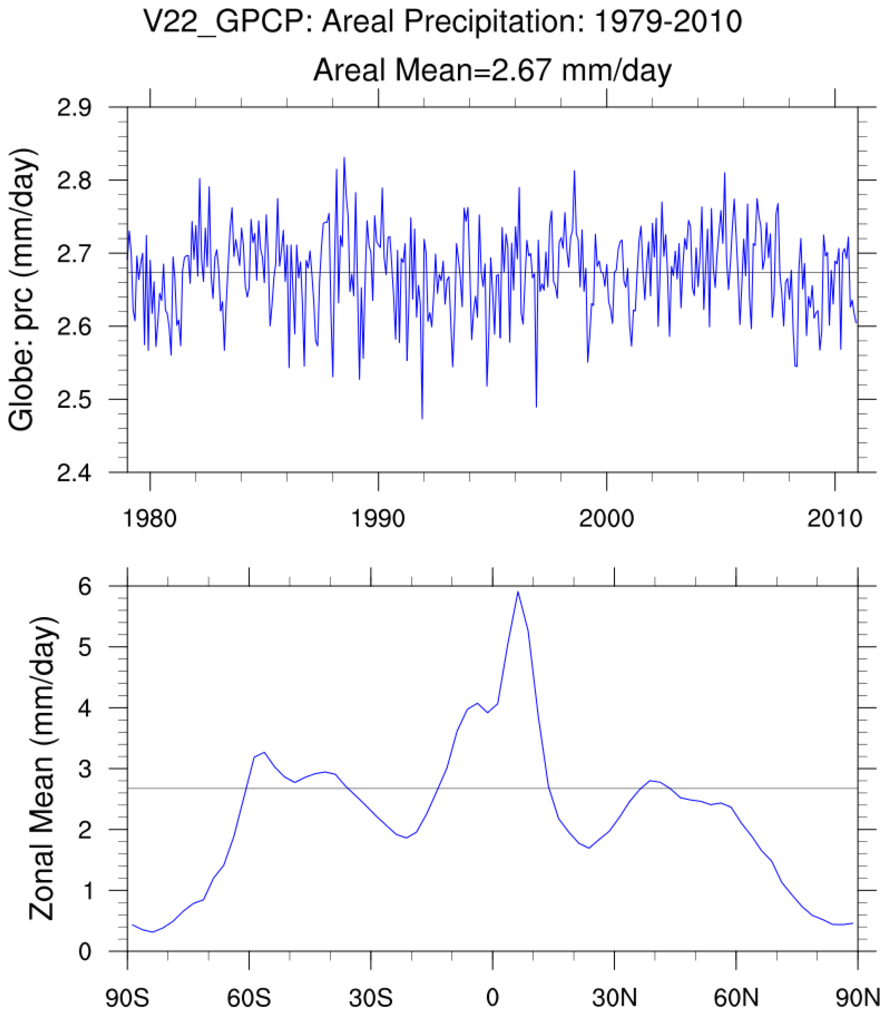 gpcp_2.ncl:
Create a time series of global monthly mean precipitation rates and
a zonal mean plot of precipitation rates.
gpcp_2.ncl:
Create a time series of global monthly mean precipitation rates and
a zonal mean plot of precipitation rates.
 gpcp_3.ncl:
Using the GPCP-1DD data calculate the raw and smoothed daily mean annual cycle
within a user specified region. In this example, the region is the Nino 3.4 region.
gpcp_3.ncl:
Using the GPCP-1DD data calculate the raw and smoothed daily mean annual cycle
within a user specified region. In this example, the region is the Nino 3.4 region.