NCL Home>
Application examples>
Plot techniques ||
Data files for some examples
Example pages containing:
tips |
resources |
functions/procedures
NCL Graphics: Isolines
Isolines
get_isolines - this function enables you to
retrieve the points that define contour lines in an NCL contour
plot. This then allows you to select particular isolines for special
processing, for example, to smooth them, remove them from the plot, or
change them in some other fashion.
Important note: there's a serious bug
in get_isolines that causes it to return
non-sensical values for NCL versions 6.4.0 and earlier. We have fixed
this bug in NCL Version 6.5.0.
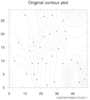
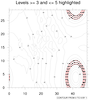 isolines_1.ncl
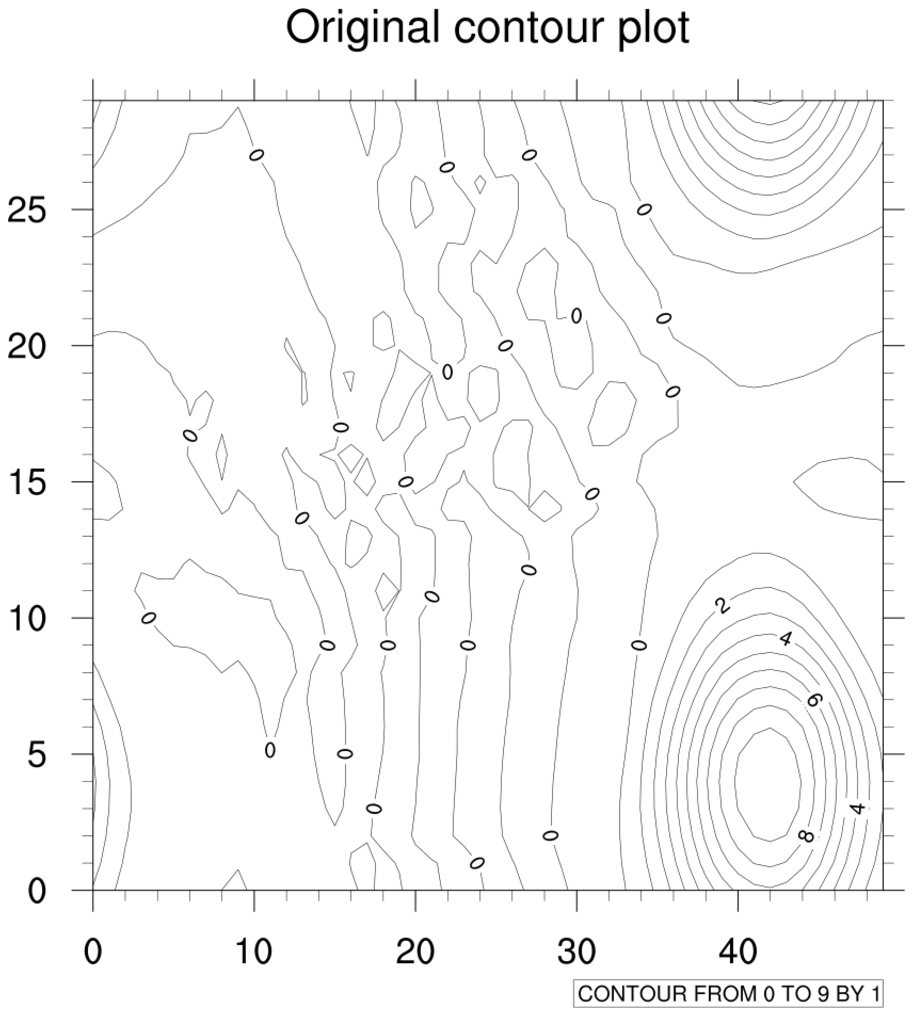
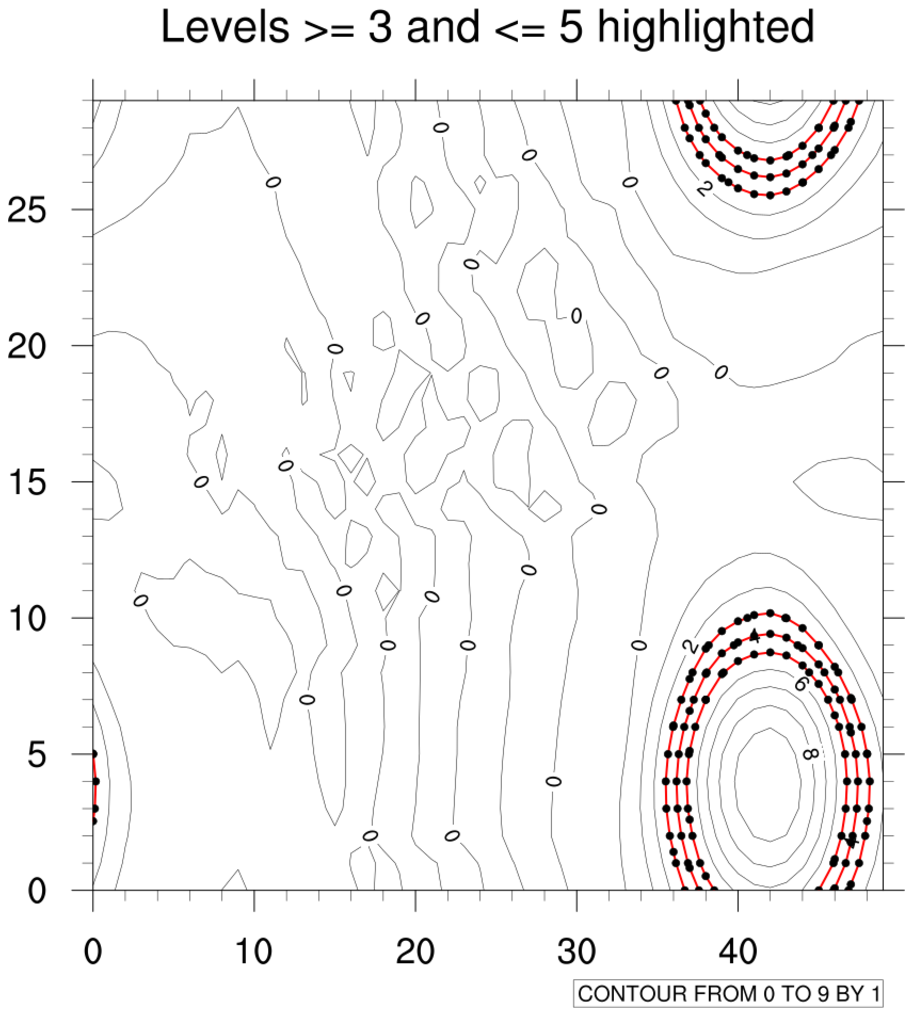
: This script shows
how to use
get_isolines to retrieve all the
isolines from an NCL contour plot, and then highlight the ones that
fall in a particular range of levels using polylines and polymarkers.
The first image is the original contour plot. The second image is
a map plot with the isolines drawn and/or highlighted with
gsn_add_polyline and
gsn_add_polymarker.
The isolines are returned as a list, so you need to use the special
"[...]" syntax to access each line.
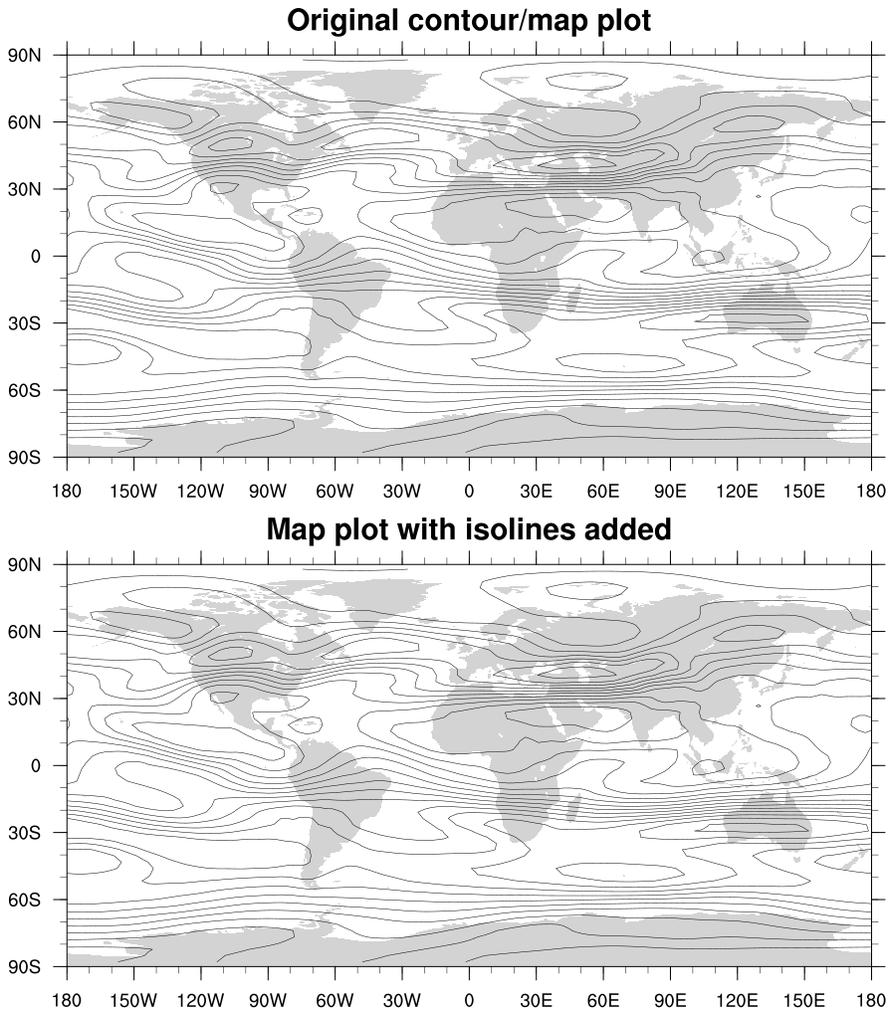
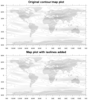 isolines_2.ncl
: This script shows
how to use
get_isolines to retrieve all the
isolines from an NCL contour plot, and redraw them on a map plot
using polylines.
The top image is the original contour plot drawn
with gsn_csm_contour_map. The bottom
image is a map plot with the isolines drawn with
gsn_add_polyline.
The two plots should be identical except for the titles.
 isolines_3.ncl
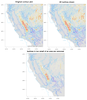
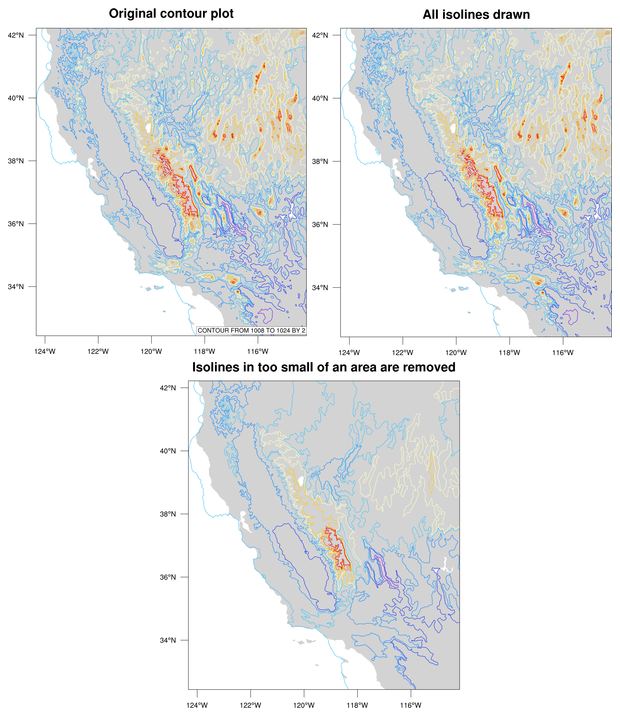
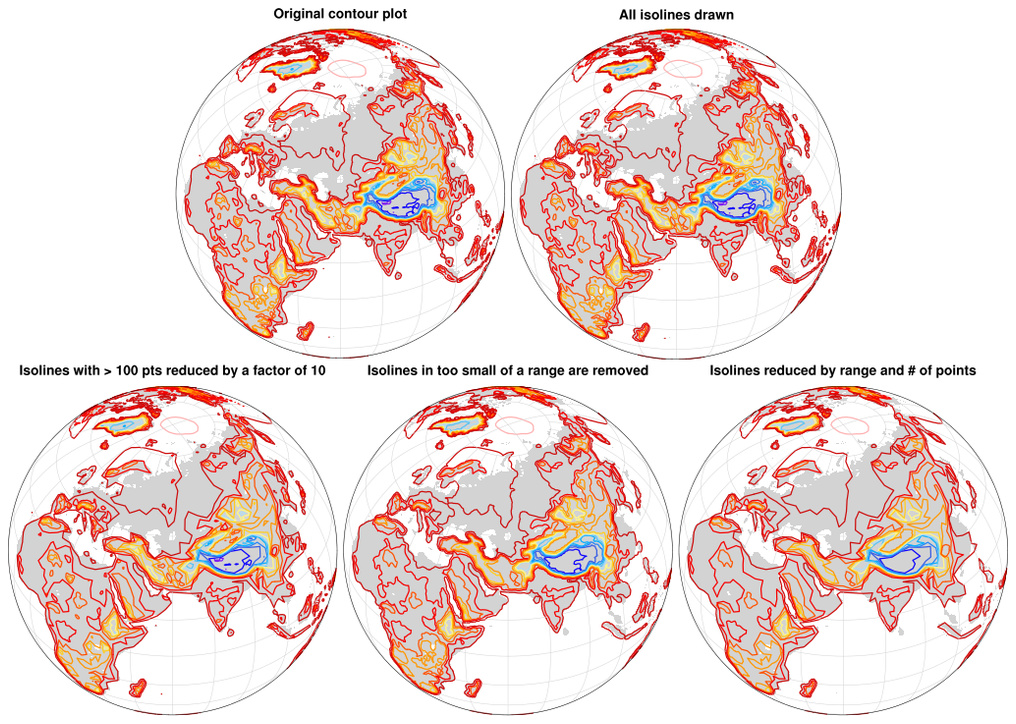
: This
script retrieves the isolines from a busy WRF contour plot, and then
uses a special function ("add_isolines_by_range") to cull some of the
isolines to make the second plot less busy.
The isolines are culled by examining the range of the lat/lon box that
each one falls in. If the lat/lon box is smaller than the given range,
then the isolines are not drawn.
The top left plot is the original contour plot. The top right plot is
a map plot with all the isolines drawn. These two plots should be
identical except for the titles. The bottom plot is with the isolines
culled.
 isolines_4.ncl
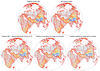
: This
script is similar to the previous WRF script, except
unstructured MPAS data is plotted, and different methods are
used to cull the busy isolines.
The top left plot is the original contour plot. The top right plot is
a map plot with all the isolines drawn. These two plots should be
identical except for the titles.
The bottom three plots show three different culling methods used:
- "add_isolines_reduced" - isolines that have a large
number of points are culled by removing every n-th point.
- "add_isolines_by_range" - isolines that are in too small of a lat/lon range are not drawn.
- "add_isolines_by_reduced_and_by_range" - isolines are culled using methods #1 and #2.
