NCL Home>
Application examples>
Plot techniques
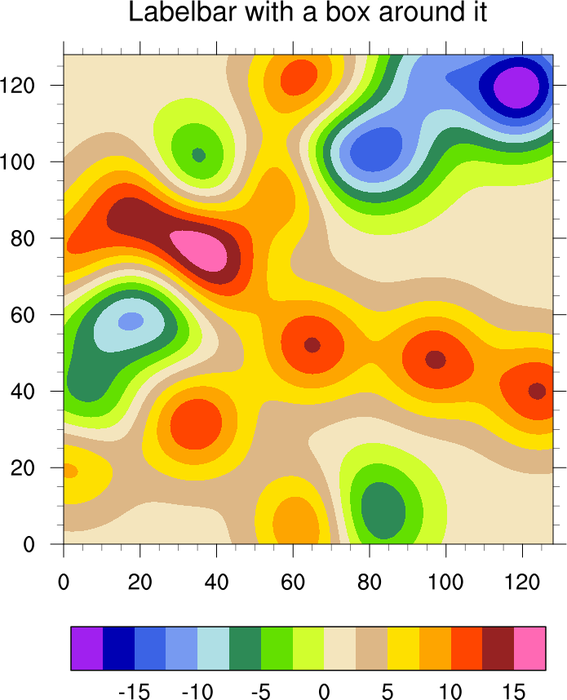
NCL Graphics: Label Bars
Labelbars are annotations that are created automatically when
you create a filled contour or vector plot (not to be confused
with legends which are associated with XY plots).
There are many resources that customize label bars. This page will
demonstrate only those we think will be commonly used. You can peruse
the list of label
bar resources for
other options.
You can create your own labelbar using functions
like gsn_create_labelbar
and gsn_labelbar_ndc.
The gsn_add_annotation function
allows you to attach a labelbar created with
gsn_create_labelbar to a plot (see
example 11 below).
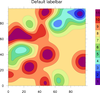
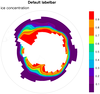
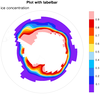
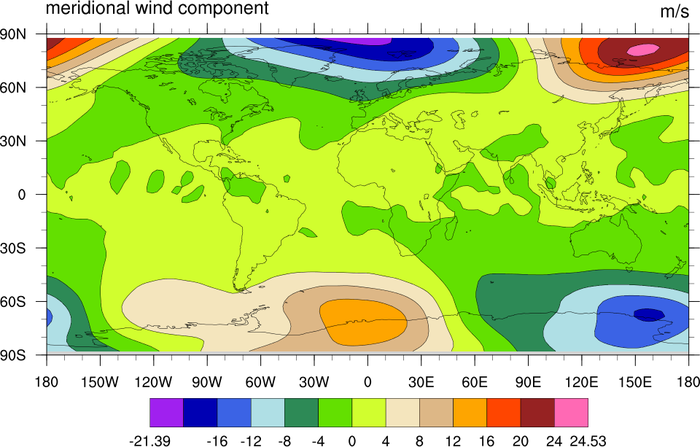
 lb_1.ncl
: Demonstrates a default
color bar. The default position is horizontal.
For the gsn_csm graphical
interfaces, setting cnFillOn =
True, automatically creates a color bar.
lbLabelBarOn = False, Will turn off
the label bar.
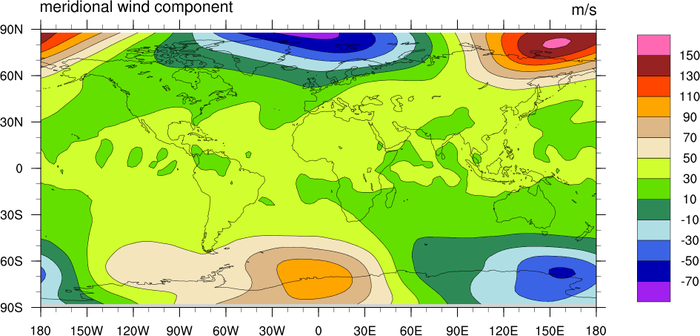
 lb_2.ncl
: Vertical label bar and
explicit labels.
lbOrientation = "vertical", Moves
the label bar to the right side vertical.
You can specify your own labels by setting lbLabelStrings equal to an array of
strings. Here we chose other numbers, but the string could have any
value.
A Python version of this projection is available here.
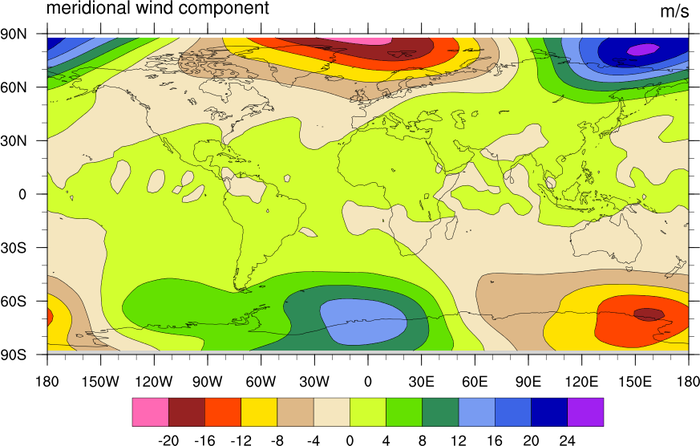
 lb_3.ncl
: Large angled labels plus
adding a title.
lbLabelAngleF, Controls the angle of
the labels while lbLabelFontHeightF,
Controls the size of the labels.
A title can be added to the label bar by setting lbTitleOn equal to True, and providing a
string using lbTitleString. The
default position of the title is on top of the label bar. Example 4
demonstrates how to move the label bar title. The size of the label
bar title can be changed with lbTitleFontHeightF.
In this example, we needed to move the entire label bar down b/c the
oversized labels ran into the plot. pmLabelBarOrthogonalPosF adjust the label
bar position perpendicular to the main plot axis. Note that this is a
pm or plot
manager resource.
A Python version of this projection is available here.
 lb_4.ncl
: Title on the side, labels
in the center.
lbTitlePosition = "Right", Moves the
title from its default top position to the right. Other options
include bottom and left. If the title position is top or bottom, the
default orientation of the title string is across. It is down if the
title position is left or right. Here we override this default by
changing the title orientation to across using lbTitleDirection.
The default position of the labels for the gsn_csm interfaces is
lbLabelAlignment = "InteriorEdges".
We have changed this to the center using lbLabelAlignment = "BoxCenters".
The default label position is bottom, but this can be changed using
lbLabelPosition.
The labels were made bolder by changing the font using lbLabelFont.
A Python version of this projection is available here.
 lb_5.ncl
: How to create a label bar
from scratch.
As we indicated in the first example, the gsn_csm graphical interfaces
automatically create a label bar if color is turned on. If you use the
generic graphical interfaces then you may need to create a label bar
from scratch.
To turn on and modify a label bar, you must first set lbAutoManage = False, and pmLabelBarDisplayMode = "Always".
The default orientation of the label bar in NCL is Vertical, and the
default side is Right. We change these with lbOrientation and pmLabelBarSide respectively.
The default label bar width and height is shorter and taller than our
aesthetic preference. Additionally, the default label font height is
huge, and a box is draw around the label bar. We have modified these
features using pmLabelBarWidthF,
pmLabelBarHeightF, lbLabelFontHeightF, and lbPerimOn.
The number of labels on the label bar can be adjusted by setting
lbLabelStride to some integer
value. You can also
use lbLabelAutoStride which
automatically determines if there is a label overlap and adjusts the
stride accordingly (as
of V6.1.0, this resource will
be True by default).
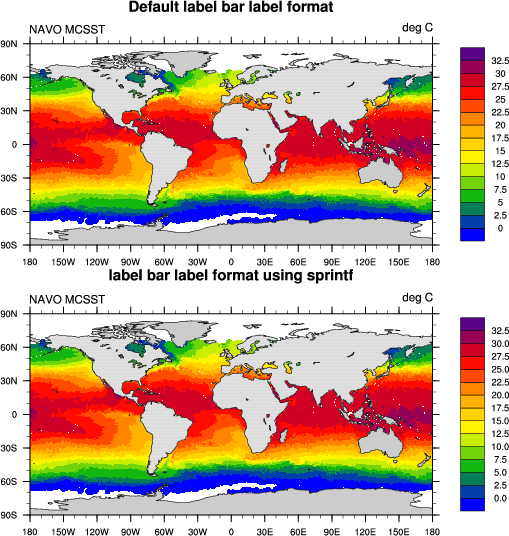
 lb_7.ncl
: Changes the format
of the label bar labels so that they are all the same. The default
is not pretty when there is a different number of decimal places.
sprintf is the function we can use to reformat the
labels. Unfortunately, this has to be done after the plot is drawn
because there is no way to do it a priori.
 lb_8.ncl
: Automatically choose best
label bar stride.
lbLabelAutoStride will automatically
determine the best stride for a label bar if it senses an overlap (as
of V6.1.0, this resource will
be True by default).
 lb_9.ncl
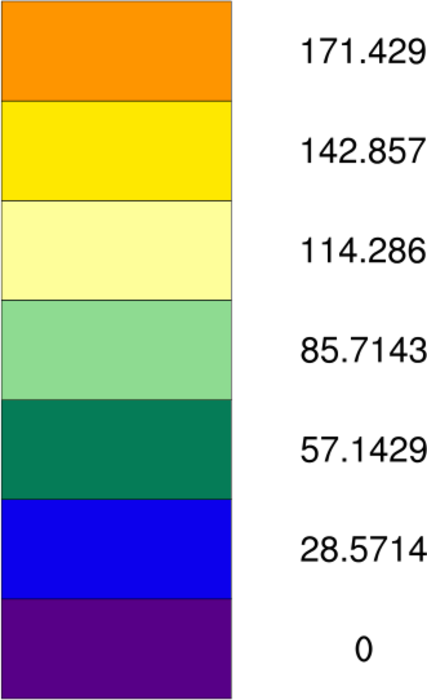
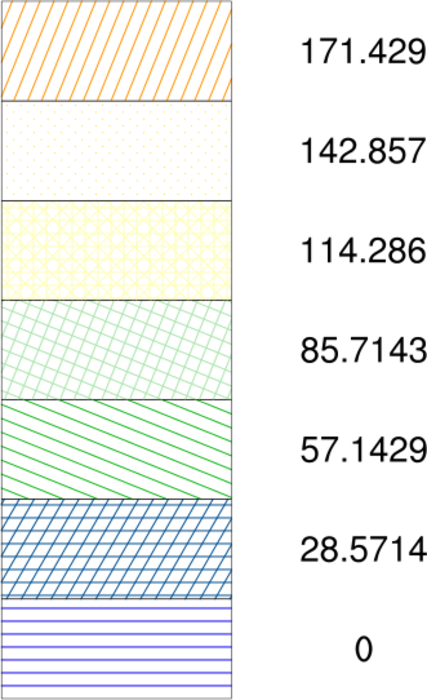
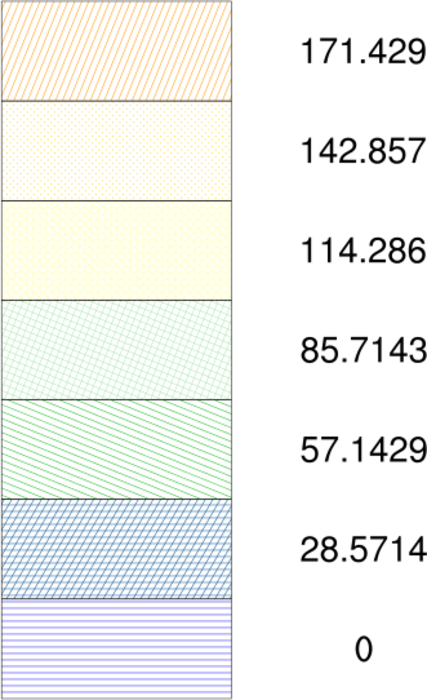
: Demonstrates how to create your
own label bar outside of a plot template call.
gsn_labelbar_ndc is the function
that will draw your own label bar. You can use any of the resources
demonstrated on this page to adjust the style of the label bar.
The first frame draws solid-filled labelbars. The second
frame draws pattern-filled labelbars by setting
lbMonoFillPattern to False and
setting lbFillPatterns to an array
of fill
patterns. The width of the pattern lines are increased by setting
lbFillLineThicknessF = 2.0.
The third frame increases the density of the fill
pattern with
lbFillScaleF = 0.5.
Note that gsnSpreadColors does not work
on this label bar. See script for discussion and solution.
 lb_10.ncl
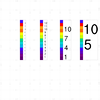
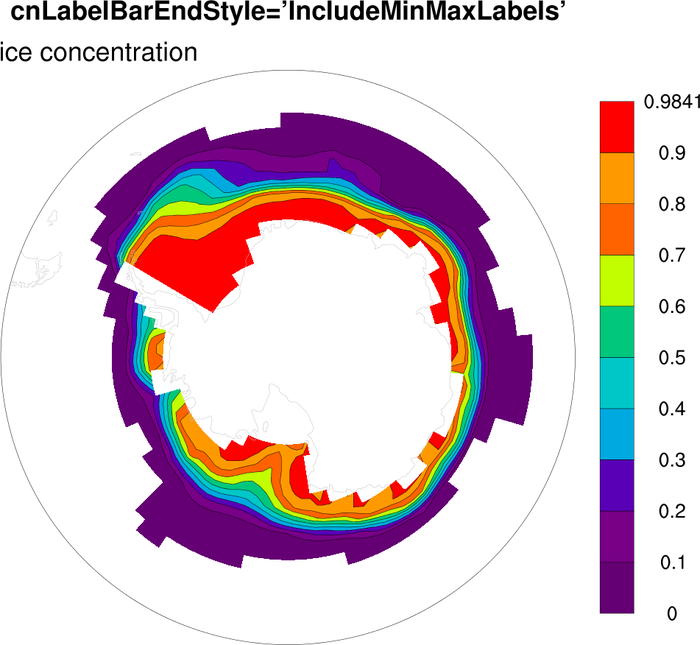
: Demonstrates how to add end
labels to a label bar.
The old method (before V5.0.0) was to set cnLabelBarEndLabelsOn to True. This has
been deprecated, and you should now set cnLabelBarEndStyle to
"IncludeMinMaxLabels". This will turn on labels at the ends of a label
bar, using the min and max values of your data.
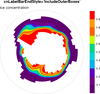
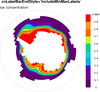
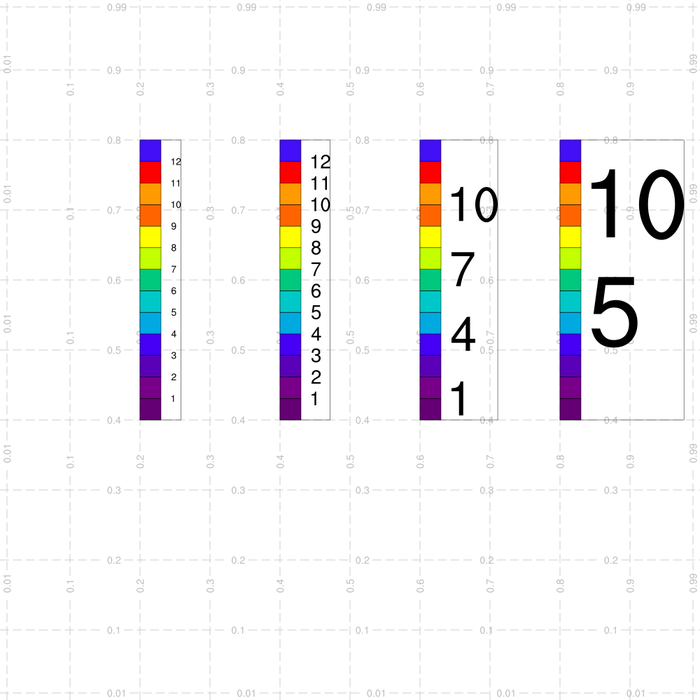
 lb_12.ncl
: Demonstrates various ways
to control the end boxes of a labelbar.
A new contour resource called cnLabelBarEndStyle was added in V5.0.0. You can
set this resource to one of three values to control how the
end labelbar boxes are handled:
- "IncludeOuterBoxes" (frame 1, the default) - the first and last labels,
representing the minimum and maximum contour levels, are aligned with
the interior boundaries of the outer boxes.
- "IncludeMinMaxLabels" (frame 2) - the outer edges of the labelbar boxes
are labeled with the min/max of the data.
- "ExcludeOuterBoxes" (frame 3) - the two outermost boxes are
removed.
 lb_13.ncl
: Demonstrates
how to finely control a labelbar with regard to size and
position.
This detailed discussion is from a posting from Dave Brown, who also
provided the script:
By default, with lbAutoManage set to
True, the LabelBar code makes sure that all elements of the LabelBar
fit inside the width and height specified using vpWidthF and vpHeightF. This requires that the LabelBar
controls the font height of the labels. However, depending on other
constraints, this often leads to text that is too small. To achieve
control of the font height, you need to turn lbAutoManage off. Once the user controls the
font height, the LabelBar can no longer ensure that everything will
fit inside the specified width and height, but it still tries to if it
can.
A significant resource is lbBoxMinorExtentF. This specifies the
proportion of the space in the direction perpendicular to the labelbar
orientation that is occupied by the labelbar. By default it is 0.33,
or 1/3 of the width specified by vpWidthF in the case of a vertically oriented
labelbar.
The total width is accounted for by five elements:
- the left margin
- the labelbar (box) width
- the label offset (which specifies a space between the labelbar and
the labels)
- the width of the longest text string
- the right margin
If all of these together amount to less than the width specified by
vpWidthF, then the labelbar and the text
are centered within the available width. This is what leads to the
variable distance from the specified position of the top left corner
of the labelbar.
To ensure that the top-left corner of the labelbar falls on the
specified point, set the resources as follows:
lbJustification = "topleft"
lbLeftMarginF = 0.0

lbTopMarginF = 0.0 ; eliminate any margin at
                   ; the top and left of the labelbar

lbBoxMinorExtentF = 1.0 ; this makes the labelbar
                        ; width equal to the full amount of vpWidthF.
As a side effect, this results in the labels being drawn entirely
outside the labelbar viewport vpWidthF =
.03 ; reduced from 0.1 to maintain approximately the labelbar width of
the original plot. lbLabelOffsetF =
.5 ; this specifies the offset between the labelbar and the labels as
a fraction of lbLabelOffsetF (for a
vertically oriented labelbar). Since lbLabelOffsetF has become smaller, this
value needs to be increased to maintain approximately the original
distance between the labelbar and the labels.
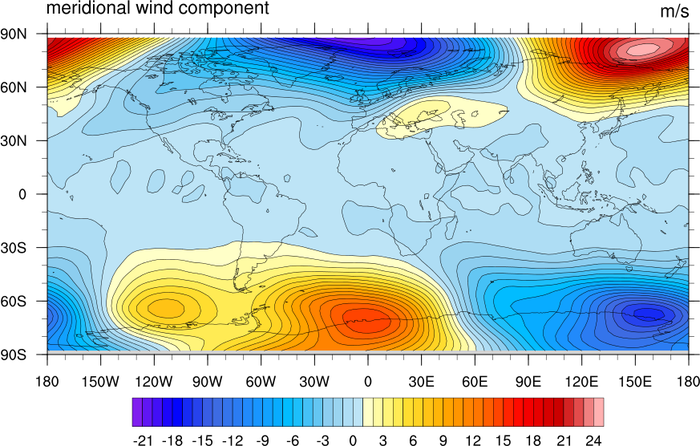
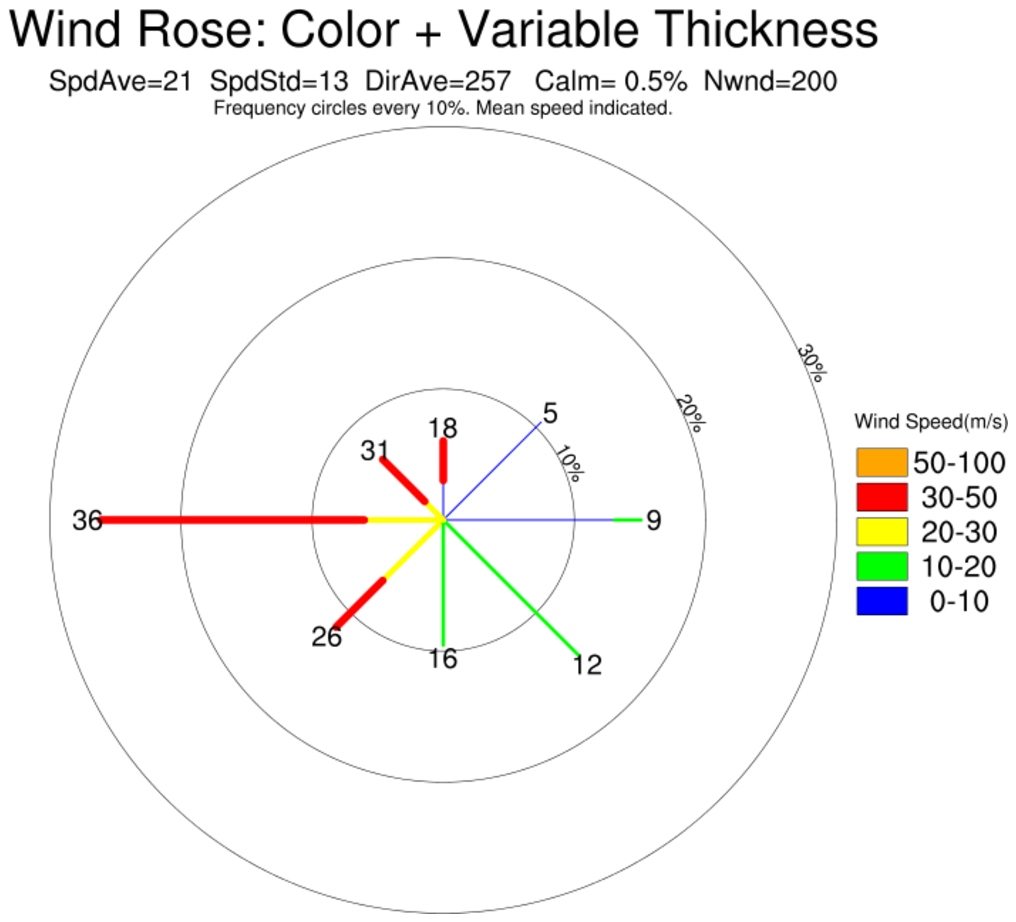
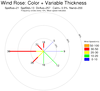 rose_5.ncl
: Add a color label to indicate wind s
peeds. (
Thanks to Zhiyong Wu, Sun Yat-sen University Guangzhou, China
for contributing the label bar code.)
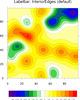

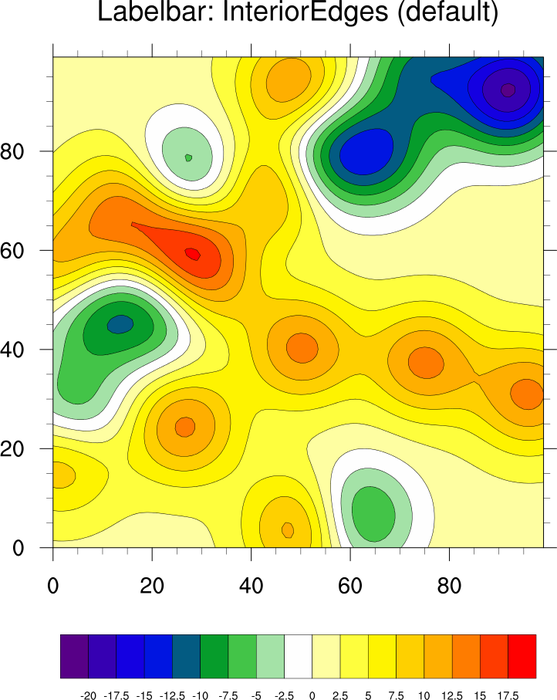
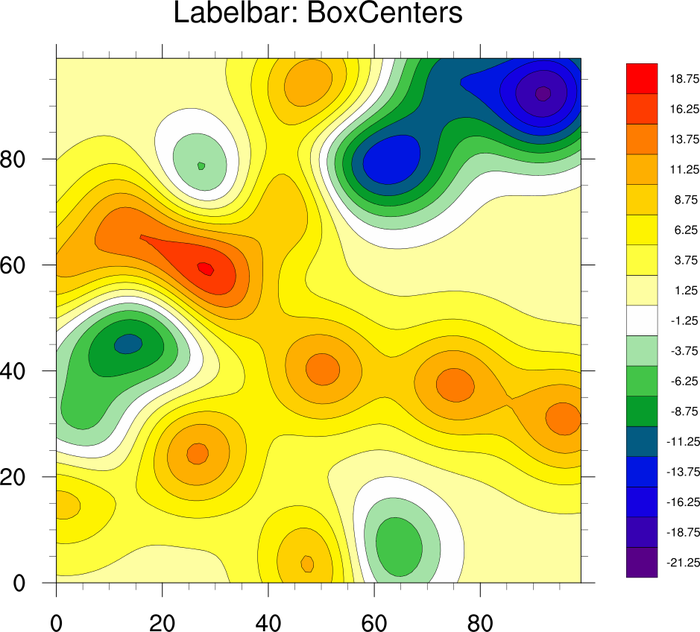
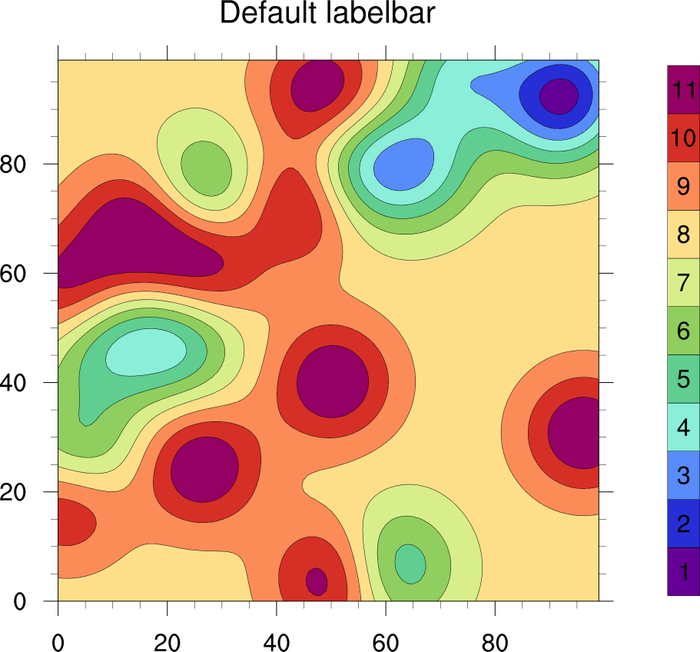
 lb_14.ncl
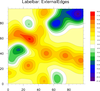
: Demonstrates the various
ways you can change the labels on a labelbar, using three different
modes for
lbLabelAlignment:
"InteriorEdges" (the default), "BoxCenters", and "ExternalEdges".
If you use "BoxCenters" or "ExternalEdges", you have to provide
the extra labels via lbLabelStrings.
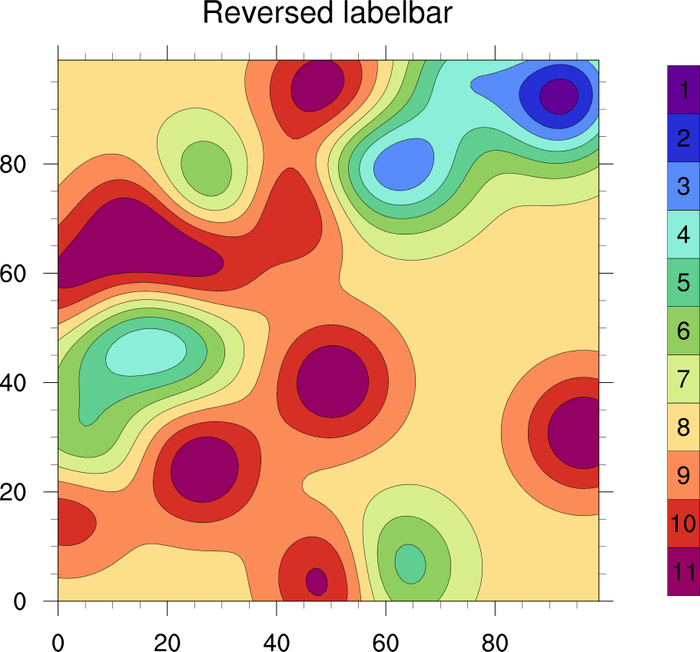
 lb_15.ncl
: Demonstrates how to
reverse a labelbar associated with a contour plot. This method
should also work for a vector plot.
You need to do this after the plot is created, because there's no
resource that reverses the labelbar for
you. The pmAnnoViews resource is
retrieved after the plot is created, to find the labelbar associated
with the plot. "getvalues" is used to retrieve the values
for lbFillColors
and lbLabelStrings, and then
"setvalues" is used to reset these resources to their reversed values.
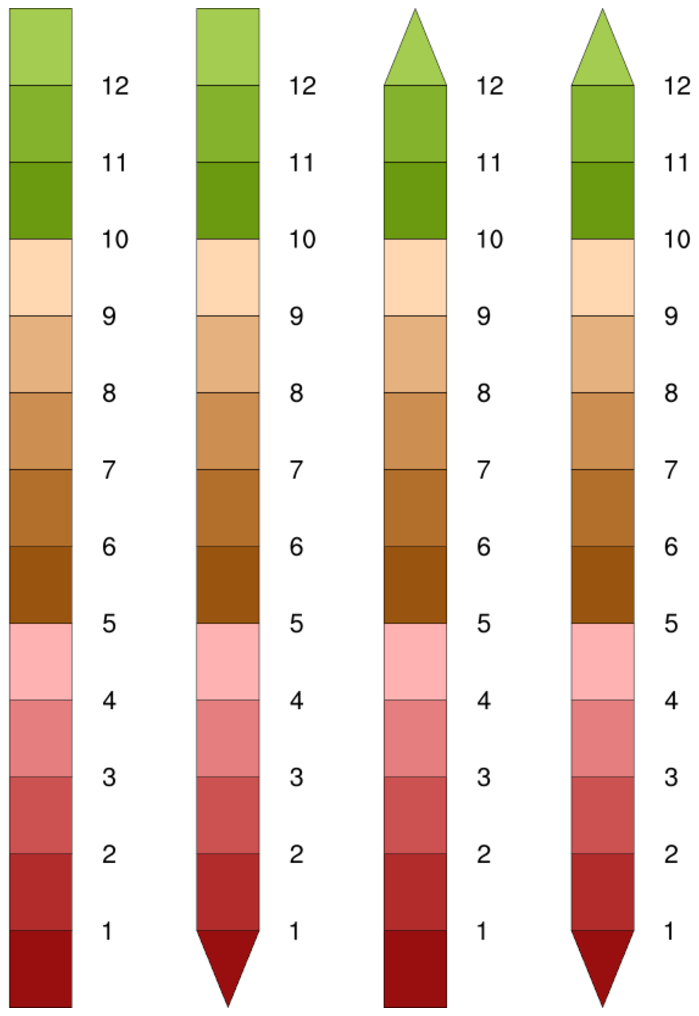
 lb_16.ncl
 /
lb_16_old.ncl: Demonstrates how to create
a labelbar with triangular ends instead of rectangular ends.
The lb_16_old.ncl script shows the old way of doing this, before NCL
V6.4.0 was released. In NCL V6.4.0, a new resource
called lbBoxEndCapStyle was added
that takes one of four values: "RectangleEnds" (the default),
"TriangleLowEnd", "TriangleHighEnd", "TriangleBothEnds".
The image with with four labelbars was created using the new resource,
while the image with the two labelbars was created using the old
method.
For the older method, you have to draw the triangles by hand. The
important thing here is you have to set
lbBoxMinorExtentF to 1.0, so that
you are assured that the vpWidthF
and vpHeightF resources apply to just
the boxes, and not the whole labelbar including the labels. This
enables us to retrieve the exact locations of the end labelbar boxes,
and replace them with filled triangles.
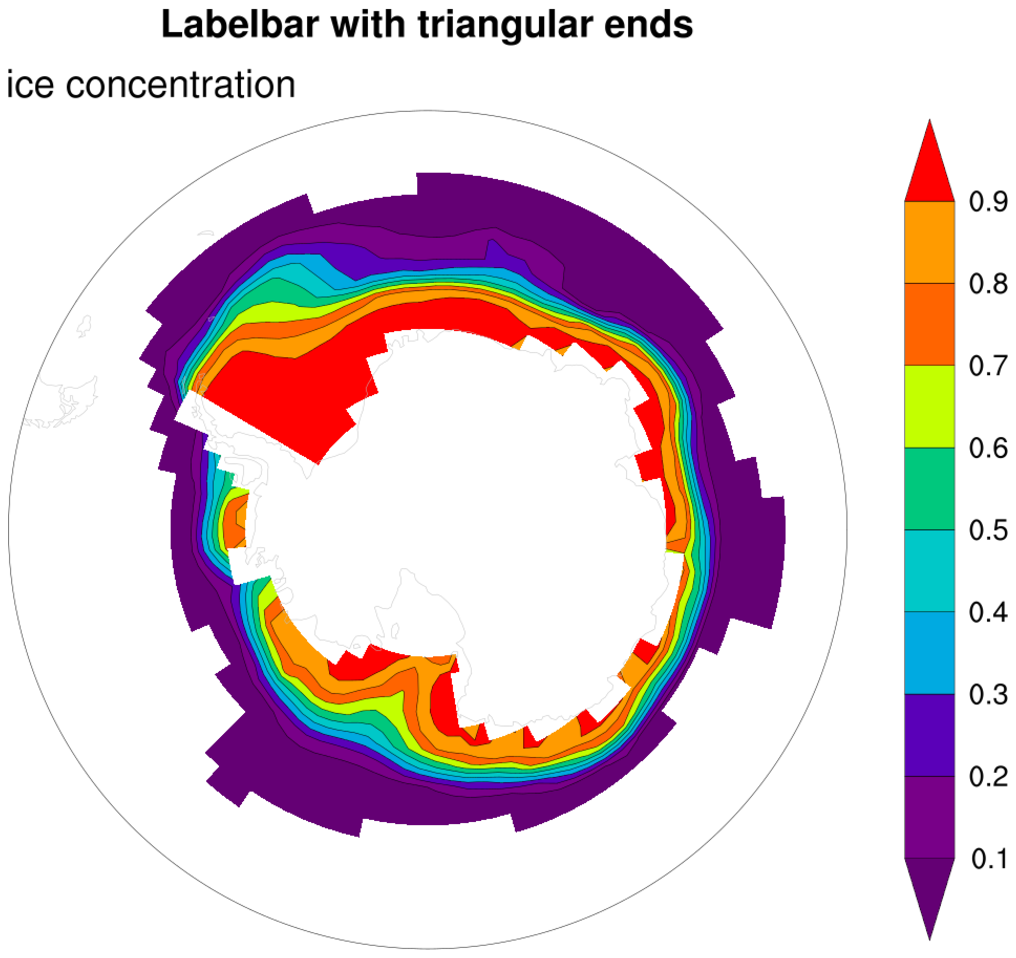
 lb_17.ncl
 /
lb_17_old.ncl: This example shows
how to draw a labelbar with triangular ends, using a new resource
added in NCL V6.4.0
called
lbBoxEndCapStyle.
The lb_17_old.ncl script shows how to do this before the new resource
was introduced. This method is very tedious as you have to recreate
the labelbar from scratch so you can determine where the ends boxes
are. You cannot panel these plots, because the triangles will
disappear. You may need to modify some of the labelbar resources
and/or variables in the "labelbar_w_tri_ends" procedure in order to
better control the position of the labelbar, its labels, and anything
else that may not be positioned correctly.
 lb_18.ncl
: This example shows how to
draw a labelbar with a box around the outer edges only.
Set
lbBoxSeparatorLinesOn to False to
turn off the interior box lines of a labelbar.

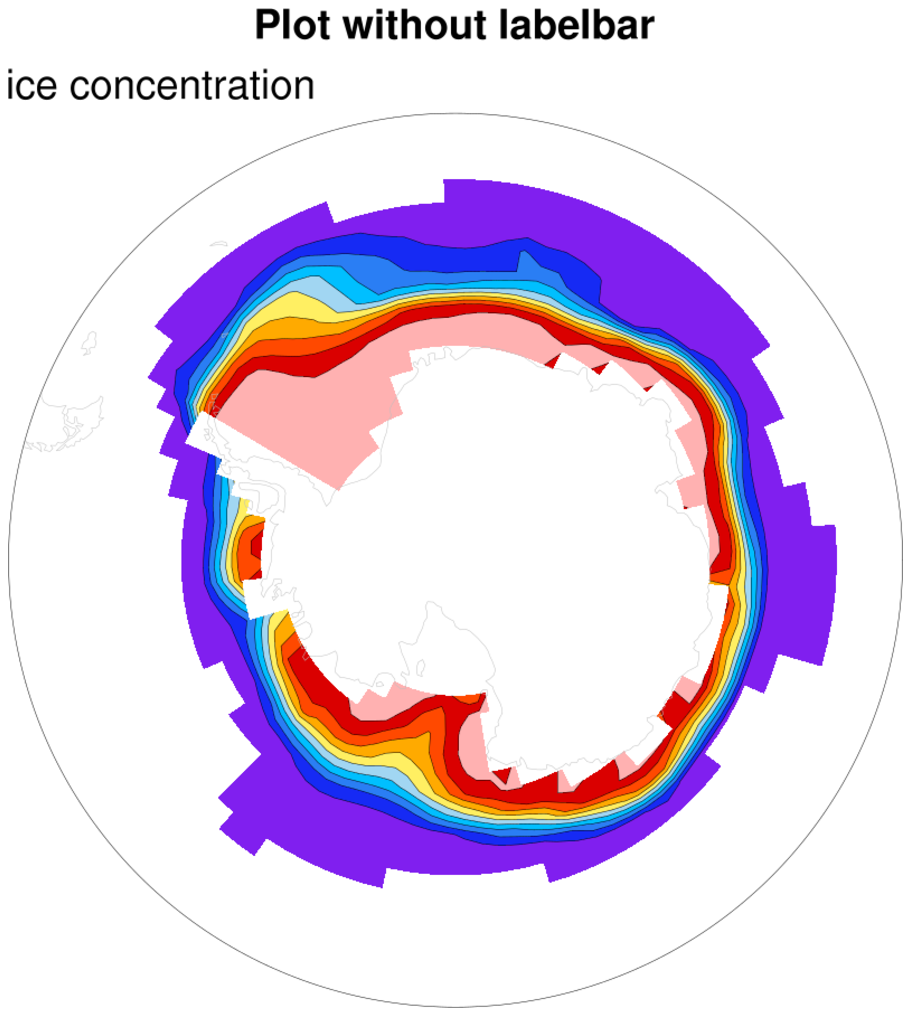
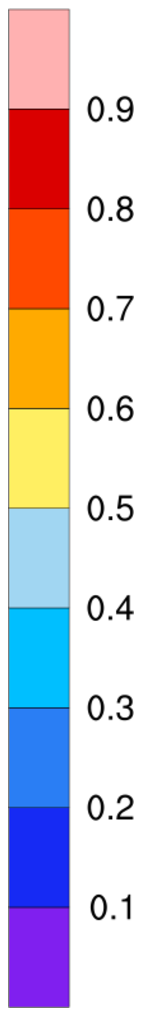
 lb_19.ncl
: This example shows how to
completely reconstruct a labelbar from scratch given a contour
plot. The labelbar should appear in the exact same place
as if it had been drawn with the plot.
The three frames show 1) the contour plot with the labelbar, 2) the
contour plot without the labelbar, 3) the reconstructed labelbar.
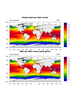
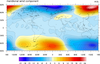
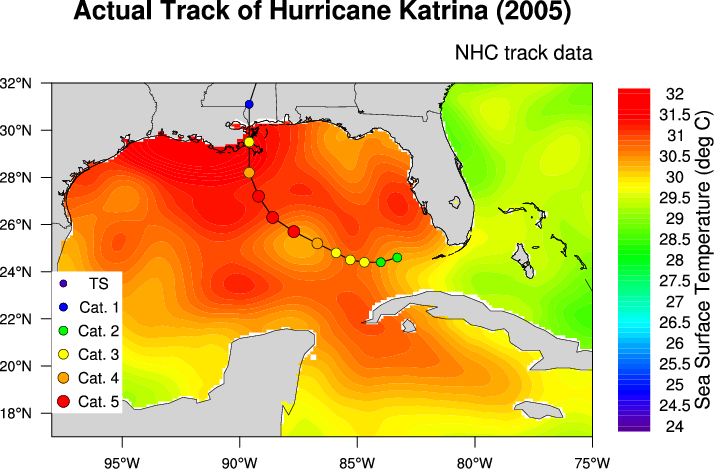
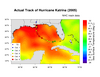 unique_8.ncl
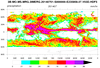
:
This script creates a contour plot of sea surface temperature and
overlays a storm track for Hurricane Katrina. It was contributed by
Kimberly Trent (a 2006
SOARS student of
NCAR/UCAR), with help from Adam Phillips and Mary Haley, also of NCAR.
The track data came from NHC reports from
the document "Tropical
Cyclone Report Hurricane Katrina" (Richard D. Knabb, Jamie
R. Rhome, and Daniel P. Brown). The SST field was
obtained from NCEP.
The storm track is done using filled and hollow circles, and
polylines. The circles are created using the
NhlNewMarker function. A legend is created using
calls to gsn_text and gsn_polymarker.
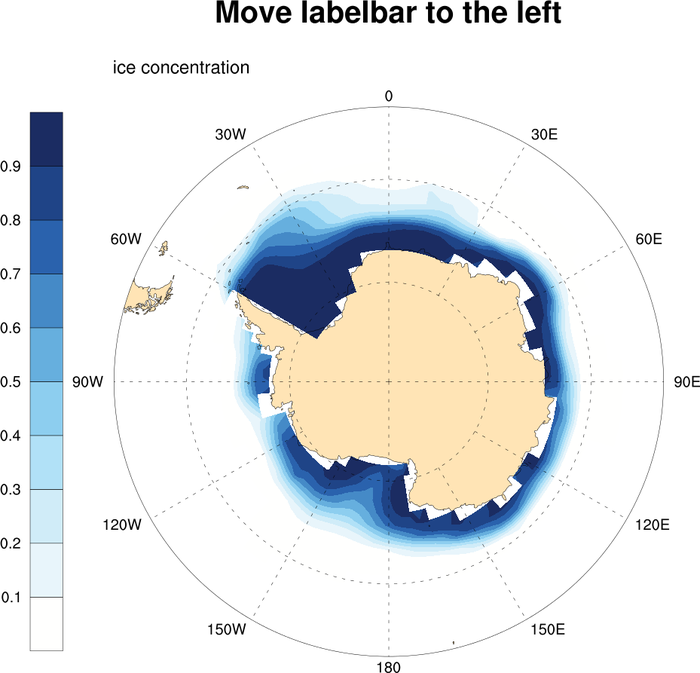
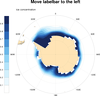 lb_21.ncl
:
This example shows how to move a vertical labelbar to
the left side of the plot.
Set pmLabelBarOrthogonalPosF to a
value of -1.0 to move the labelbar to the left side of the plot, and
then use slightly smaller values than this (-1.25) to move it just
outside the plot.
lbLabelPosition is set to "left" to
move the labelbar labels to the left side of the labelbar.


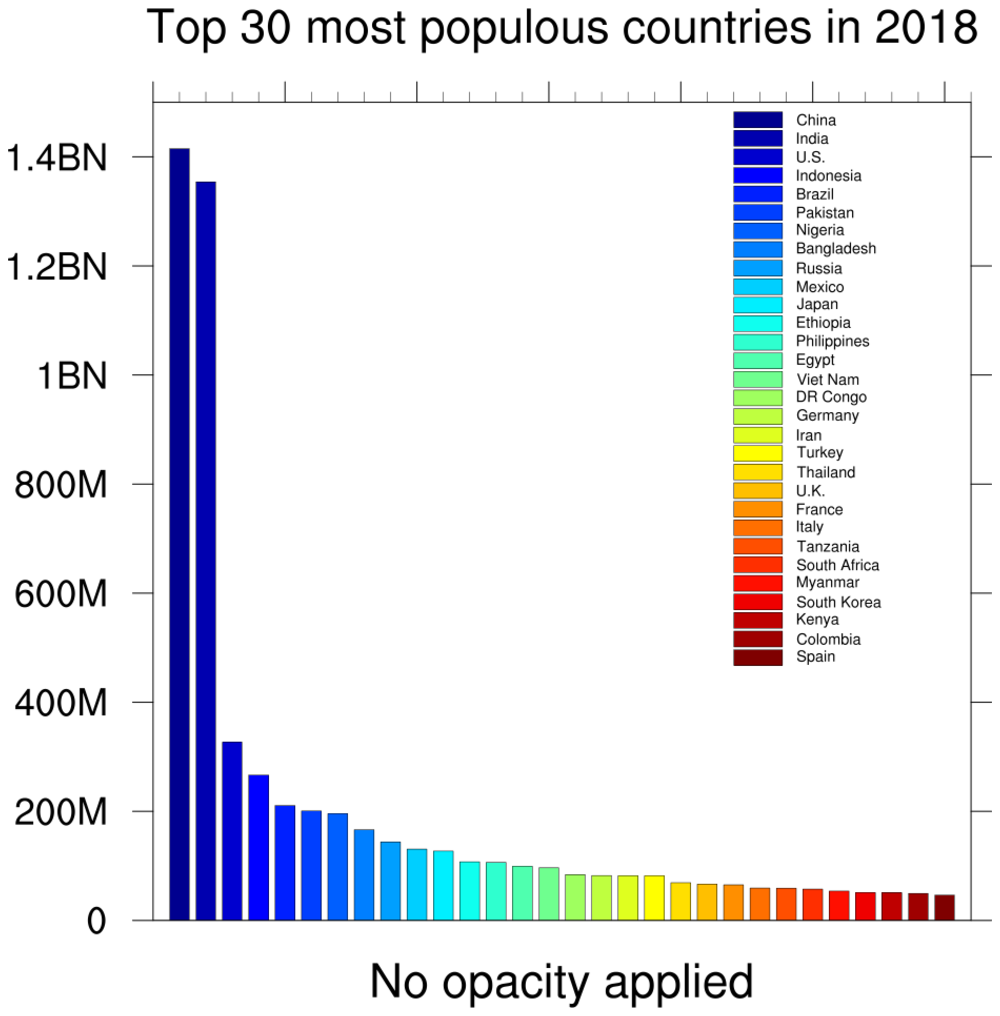
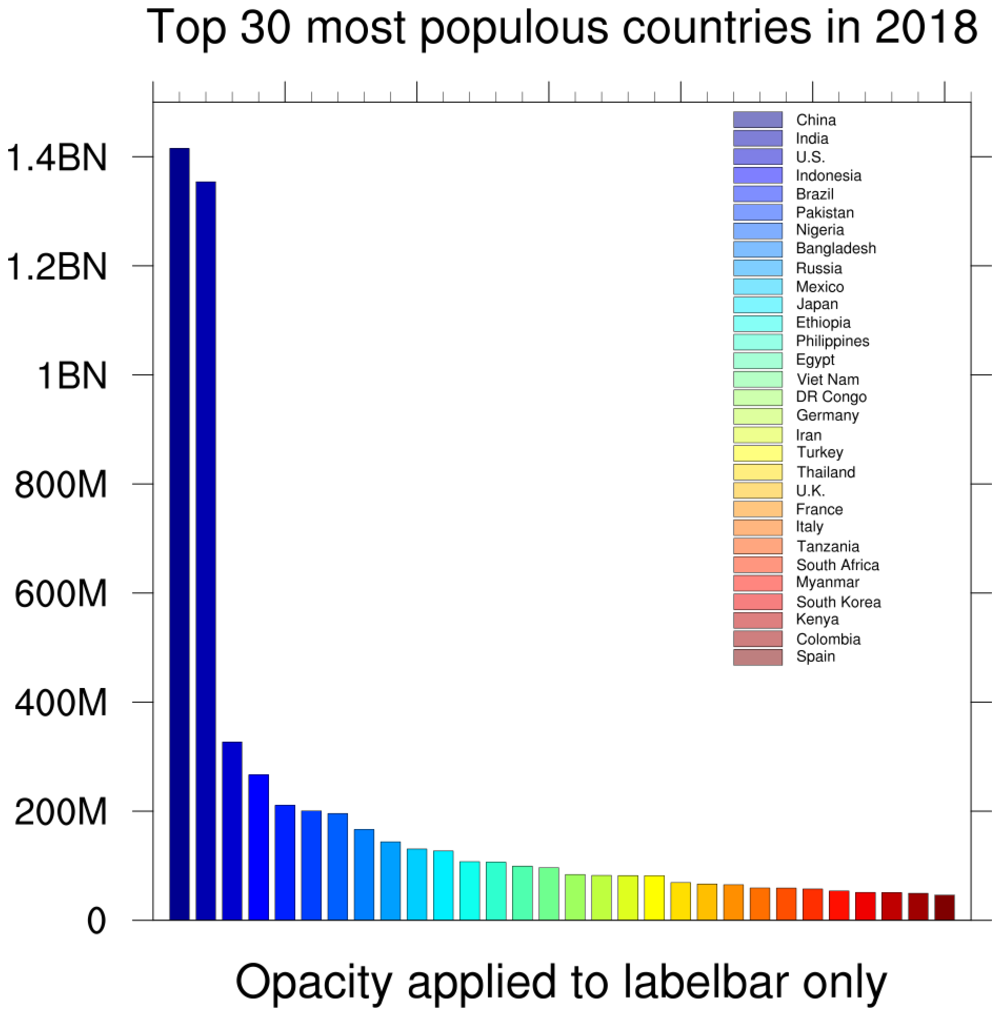
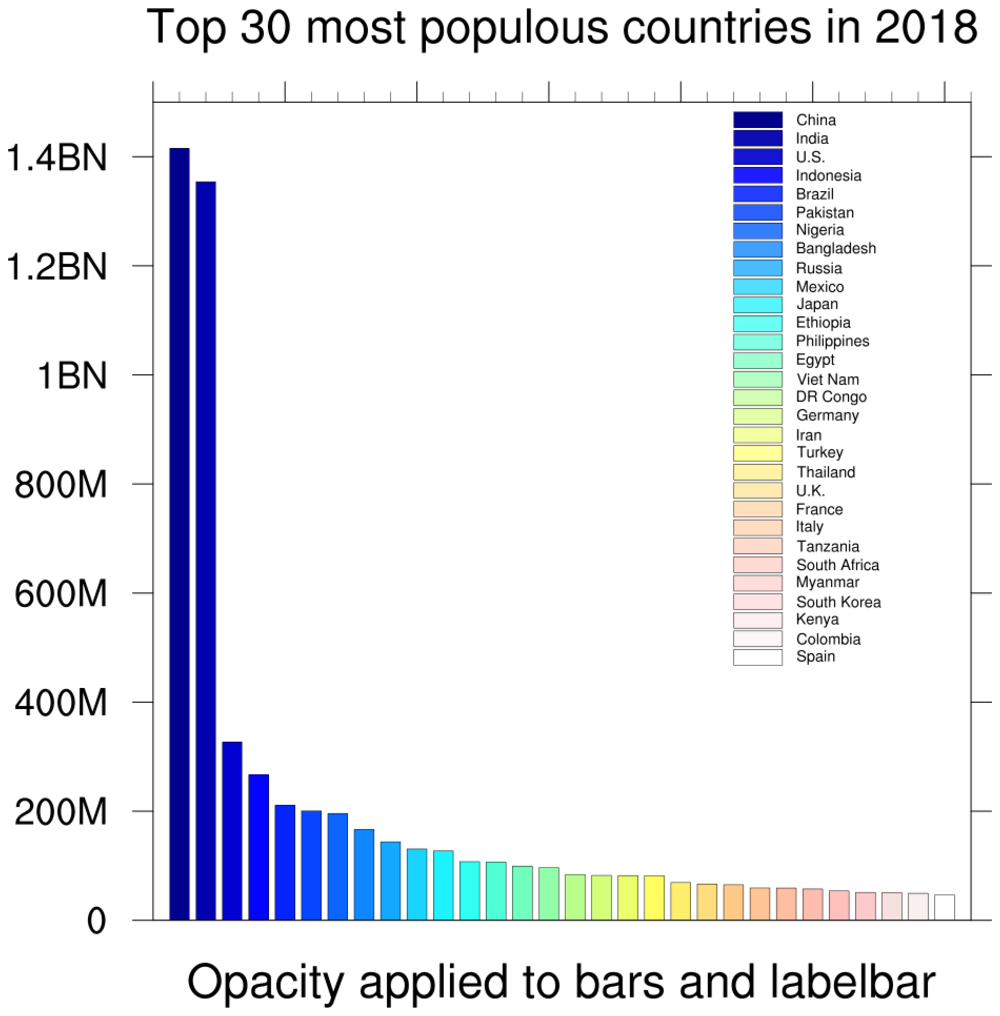
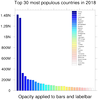 lb_22.ncl
:
This example shows how to apply different opacities to a bar plot
and a custom labelbar.
The first frame is the plot without any opacity. The second frame has
the opacities applied to both the filled bars and labelbar, using
an RGBA array of colors with the opacity index (index 3) set to
a range of opacities.
The third frame uses a resource introduced in NCL V6.4.0,
lbFillOpacityF, that allows you to
set a single opacity value for a labelbar. This resource is primarily
meant to be used when creating a custom labelbar, and not with
a labelbar associated with a filled contour or vector plot. As of NCL
V6.4.0, any opacity applied to a contour or vector plot via resources
like
cnFillOpacityF
or vcGlyphOpacityF will have the
same opacity applied to the labelbar.
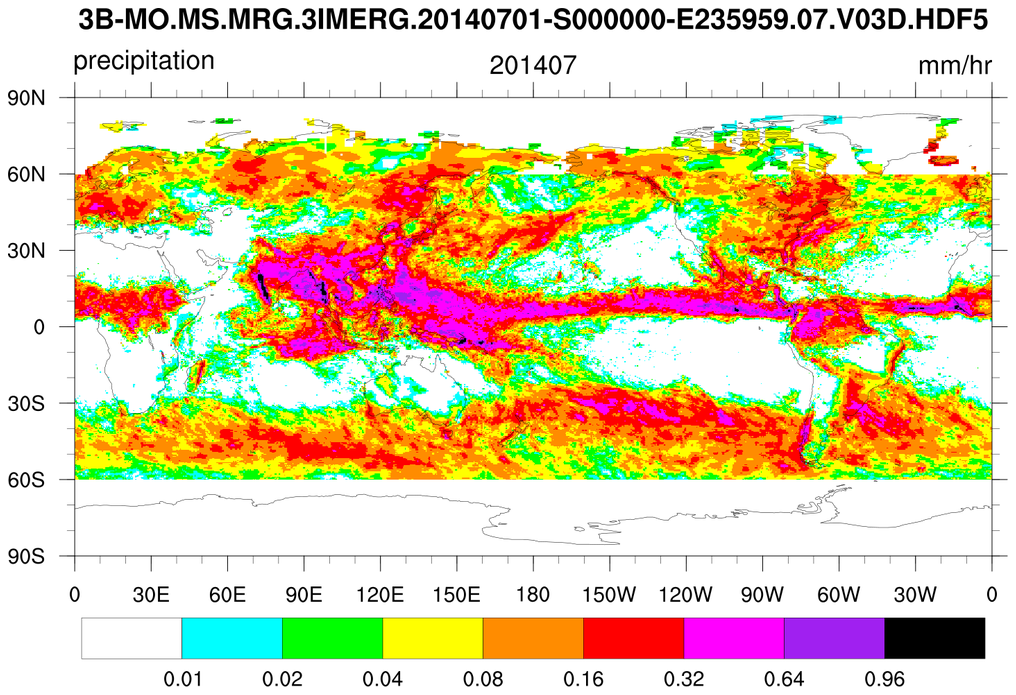
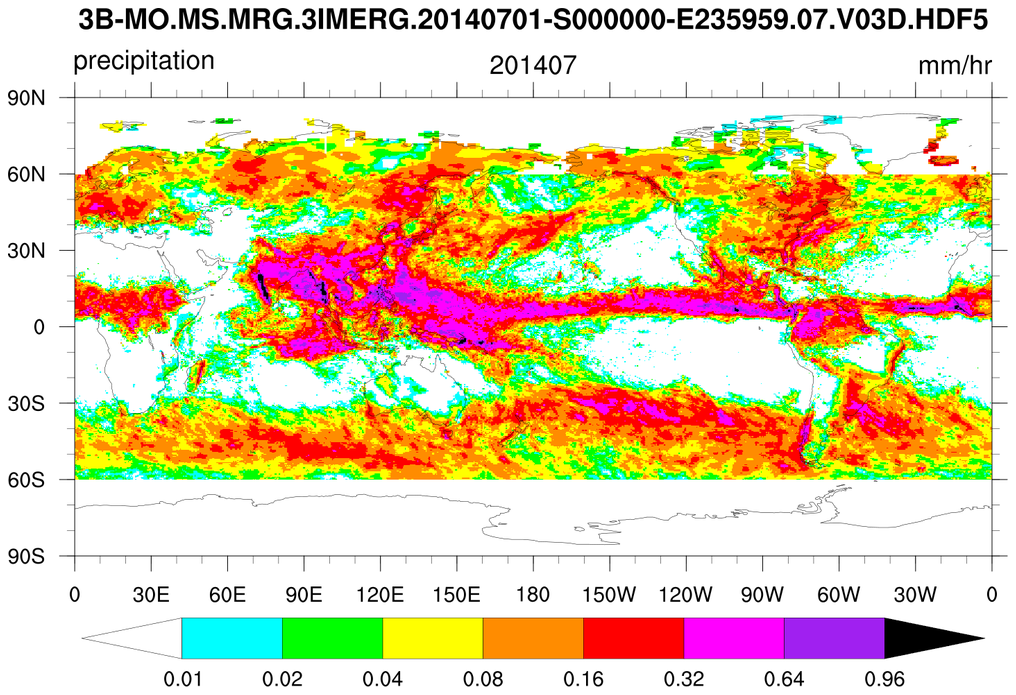
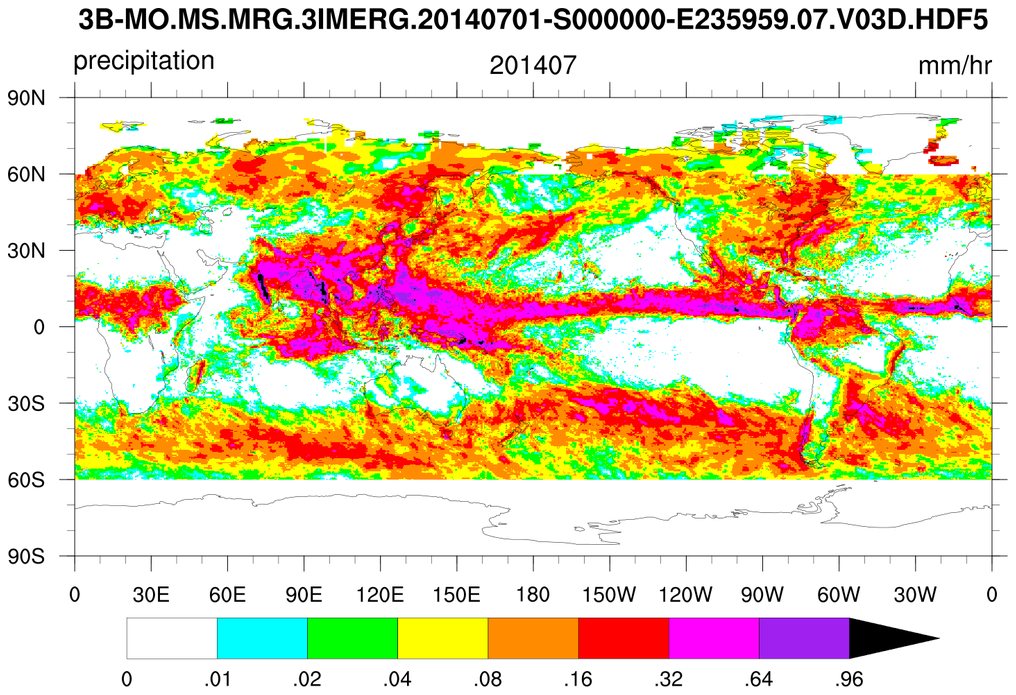
 gpm_1.ncl
:
This example shows how to customize a labelbar to have triangular
ends and/or labels on the end boxes.
In NCL Version 6.4.0, a new labelbar resource
called lbBoxEndCapStyle was added
that allows you to force one or both of the end labelbar boxes to be
drawn as triangles. The second two plots of this example show two ways
of using this resource to customize the labelbar.
A 'trick' was used in the third plot to add a minimum label to the
labelbar, first by setting
res@cnLabelBarEndStyle to
"IncludeMinMaxLabels". But, since we don't actually want to see the
maximum value on the labelbar, we customized the labels ourselves, by
creating an array of strings with the rightmost string set to an empty
string.
 corel_3.ncl
: This
example shows how to remove the end boxes of a labelbar, by
setting res@
cnLabelBarEndStyle to
"ExcludeOuterBoxes".
This can be useful when you know there are no values that go beyond
the high and low values of the contour levels, which are set to -1 and
1 in this example.
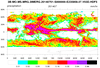
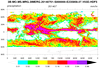
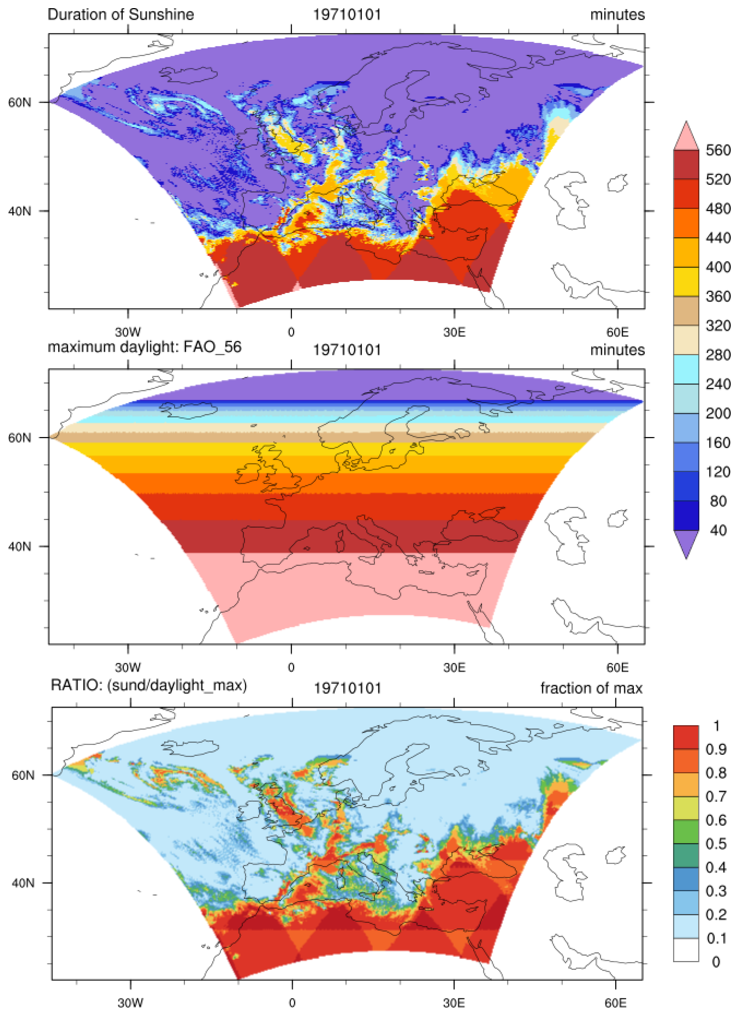
 fao56_3.ncl
:
Use
daylight_fao56 to calculate the maximum daylight duration
as described in
FAO 56.
Compare the theoretical maximum daylight with the modeled ('observed') sunshine duration
for a particular day by computing the ratio.
Use two different types of label bars: (a) triangle ends and (b) fixed ends with no outer boxes.


