Example pages containing: tips | resources | functions/procedures
NCL Graphics: Masked Lambert Conformal Projections
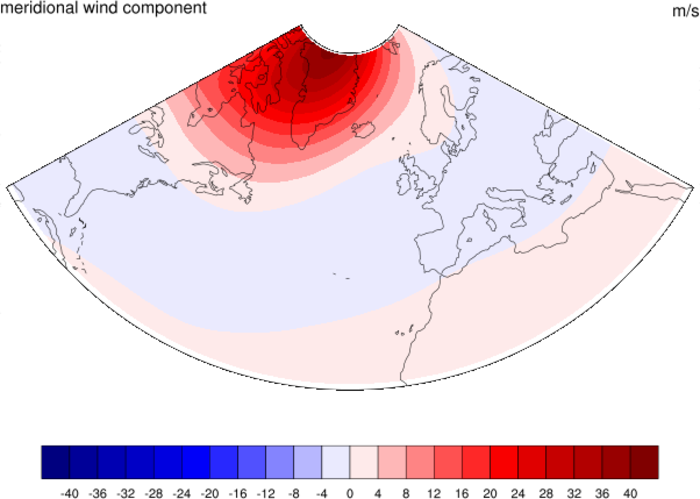
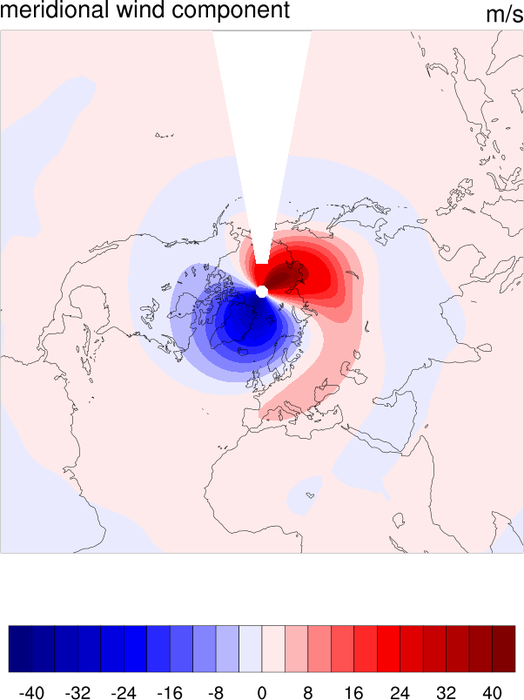 lcmask_1.ncl: Unmasked and masked
lambert conformal projection.
lcmask_1.ncl: Unmasked and masked
lambert conformal projection.
mpProjection = "LambertConformal" turns on the correct projection.
gsnMaskLambertConformal = True will turn on the projection masking.
To mask the projection, you must set the boundaries with the following
resources:
mpMinLonF
mpMaxLonF
mpMinLatF
mpMaxLatF
It is also required to set gsnAddCyclic to False whenever you plot a non-global domain.
A Python version of this projection is available here.
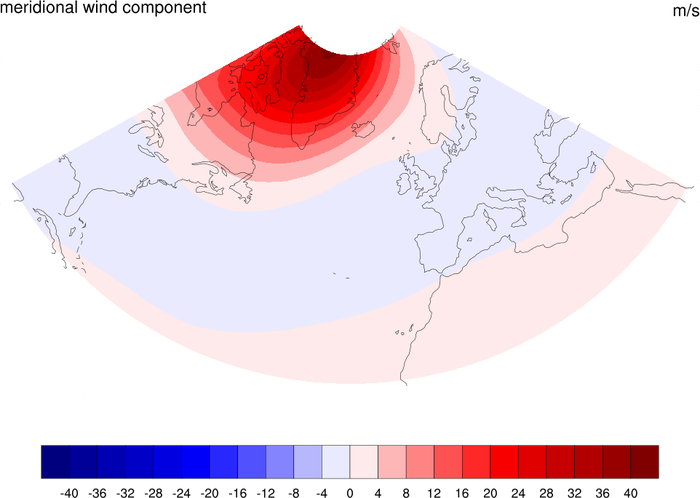 lcmask_2.ncl: Maximized example
with outline turned on.
lcmask_2.ncl: Maximized example
with outline turned on.
gsnMaximize enlarges the plot to the point where the fonts are legible. For this type of plot, you will probably want to always have this resource turned on.
gsnMaskLambertConformalOutlineOn turns off a border around the plot
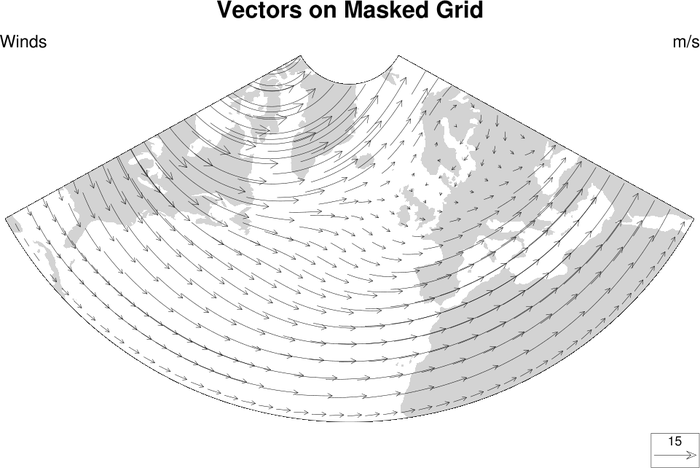
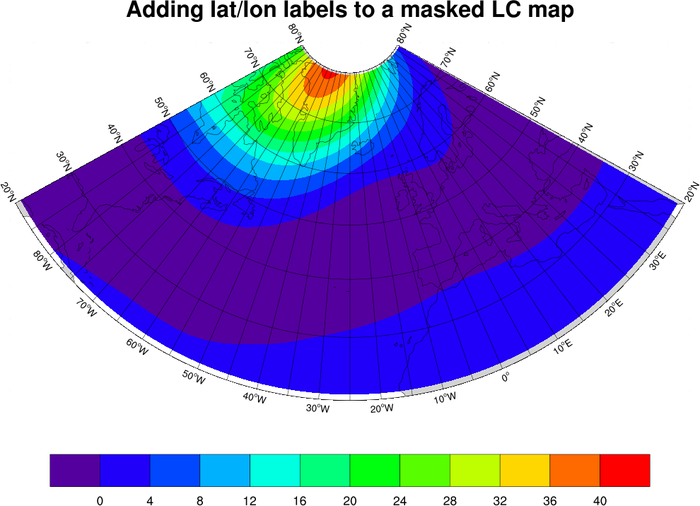 lcmask_4.ncl: Shows how to add your
own longitude/latitude labels to a masked Lambert Conformal plot.
The gsn_add_text function is use to attach the labels. The
angle of the strings is calculated by converting lat/lon values to NDC
space (datatondc) and then
using atan to get the angle.
lcmask_4.ncl: Shows how to add your
own longitude/latitude labels to a masked Lambert Conformal plot.
The gsn_add_text function is use to attach the labels. The
angle of the strings is calculated by converting lat/lon values to NDC
space (datatondc) and then
using atan to get the angle.
This script uses a procedure called "add_lc_labels" to add the lat/lon labels. You may need to increase or decrease the lat_spacing or lon_spacing arguments if you are not satisfied with the results.