Example pages containing: tips | resources | functions/procedures
NCL Graphics: Component Models: LSM
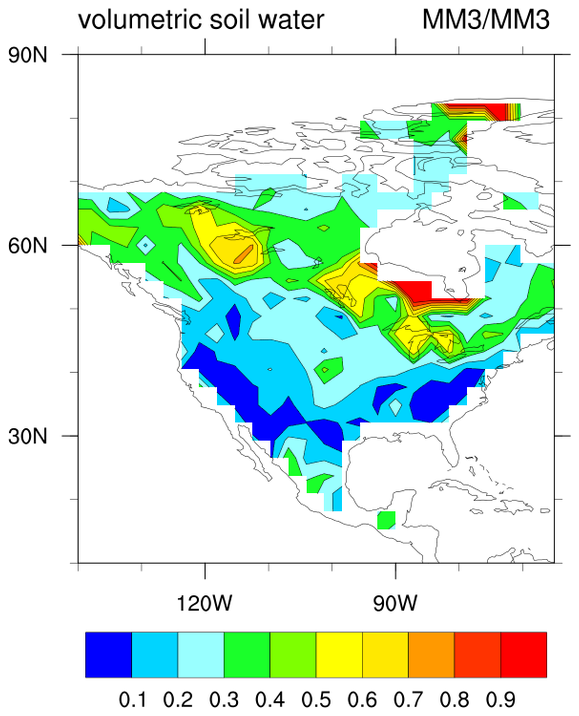 lsm_1.ncl: Color plot of an LSM field.
The primary thing to note is that an _FillValue must be assigned, and the coordinate arrays must be renamed.
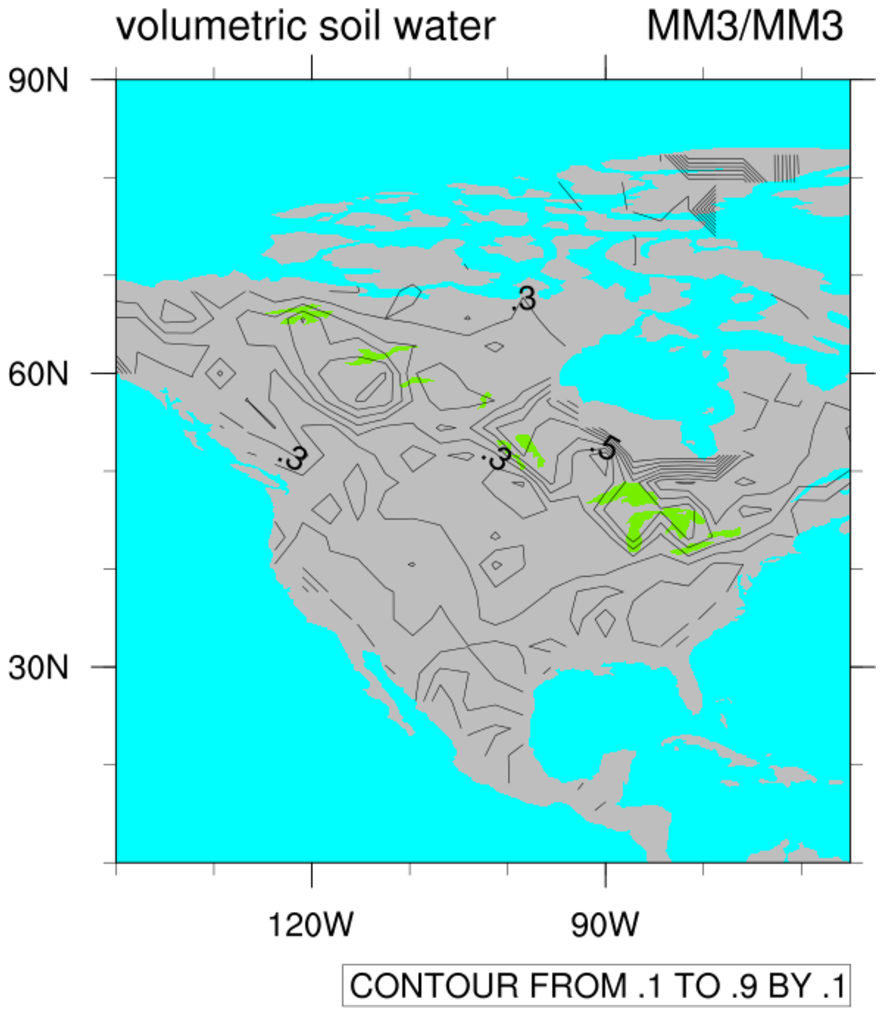 lsm_2.ncl: Demonstrates how to draw
plan contours over gray continents with a blue ocean.
lsm_2.ncl: Demonstrates how to draw
plan contours over gray continents with a blue ocean.
mpFillColors = (/0,9,28,25/) selects which colors out of the default color map to use in the plot. First is the foreground, black, which is used for the lines, next is the background which is normally white, but in this case is light blue. Then there is a light gray for the continents, and finally, a green for the lakes. If you left off this last value, the lakes would be colored blue like all the other missing values. Note we do not turn on color fill here.
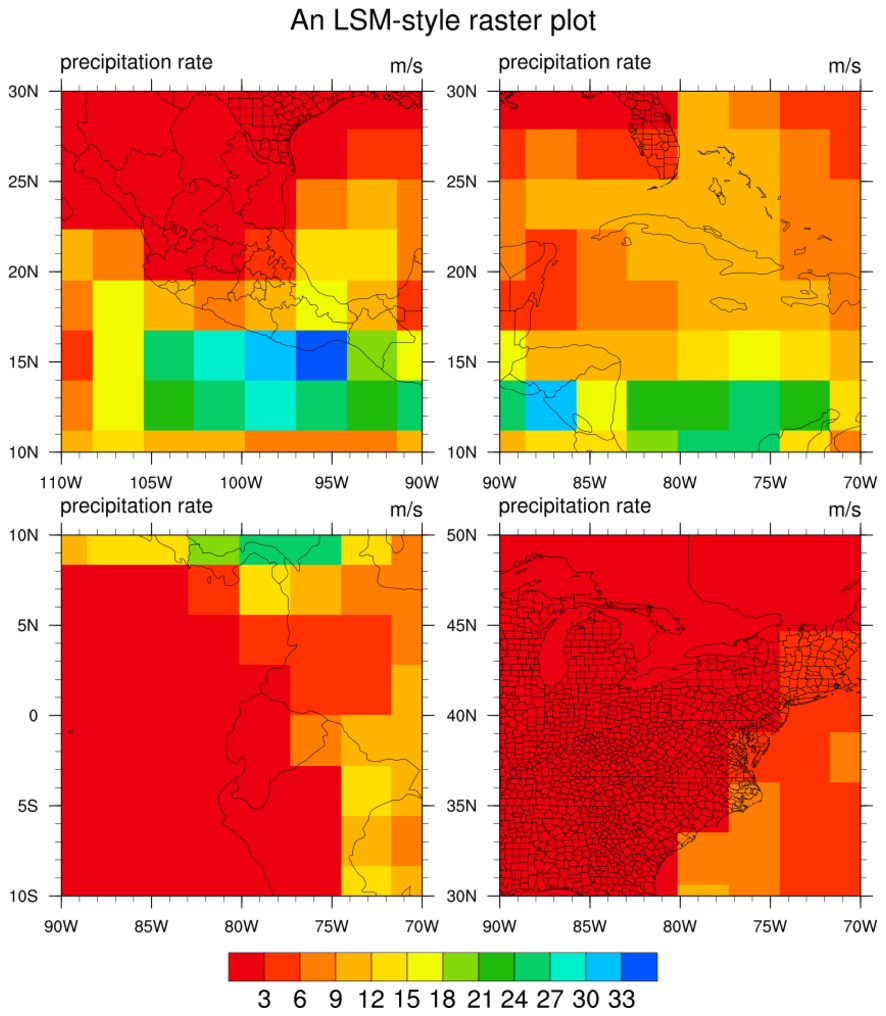 lsm_3.ncl: Demonstrates a raster type
plot with LSM implications. The data is precipitation, which is on
an atmospheric file, but this type of plot is used by the LSM
community. Thanks to Andrea Hahmann from the University of Arizona
for giving me this plot style.
lsm_3.ncl: Demonstrates a raster type
plot with LSM implications. The data is precipitation, which is on
an atmospheric file, but this type of plot is used by the LSM
community. Thanks to Andrea Hahmann from the University of Arizona
for giving me this plot style.
mpOutlineBoundarySets = "AllBoundaries", Will draw both US State boundaries and other national boundaries.