NCL Home>
Application examples>
Maps and map projections ||
Data files for some examples
Example pages containing:
tips |
resources |
functions/procedures
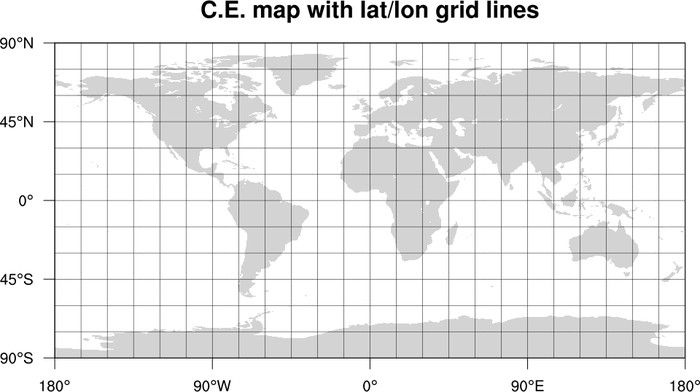
NCL Graphics: Lat/lon grid lines on maps
Drawing maps with lat/lon grids
Drawing lat/lon grid lines on map can be done
by setting
mpGridAndLimbOn to True.
Resources to control the look of the lat/lon lines include those that
start with "mpGrid":
To draw the lat/lon grid associated with a particular variable, see
the "Drawing locations of data values via
markers or lines" examples page.
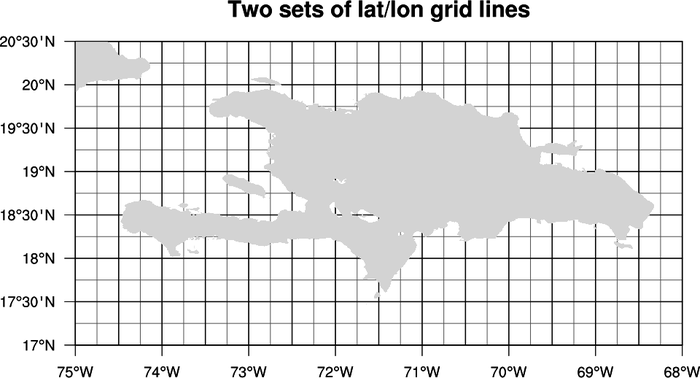
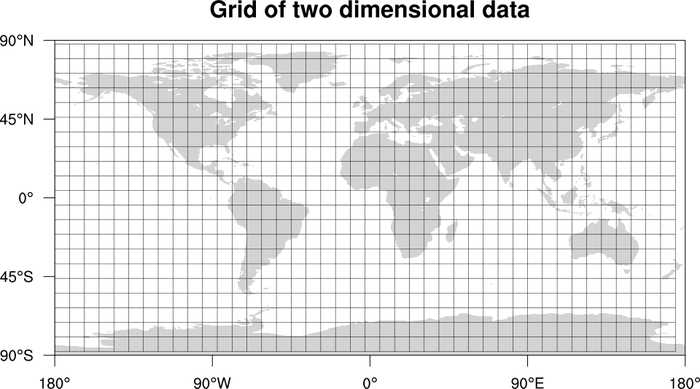
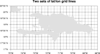 mapgrid_3.ncl
:
Shows how to draw two sets of map lat/lon grids with different
spacings and colors. To do this, you need to create two map plots, and
then add one map as an annotation of another
with
gsn_add_annotation.
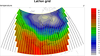
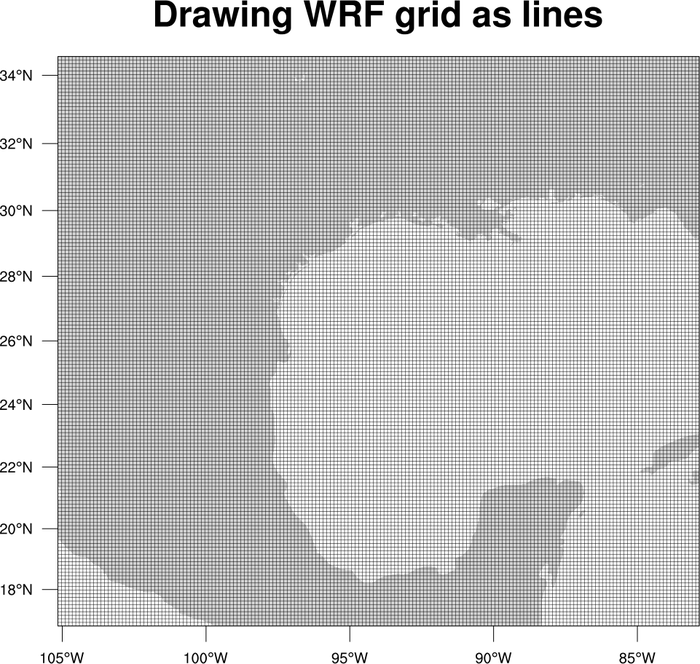
 mapgrid_5.ncl
:
Shows how to draw lat/lon lines using using lat/lon coordinate arrays
attached to a variable read off a NetCDF file. Note that only every
third lat/lon line is drawn, to keep the plot from being too busy.
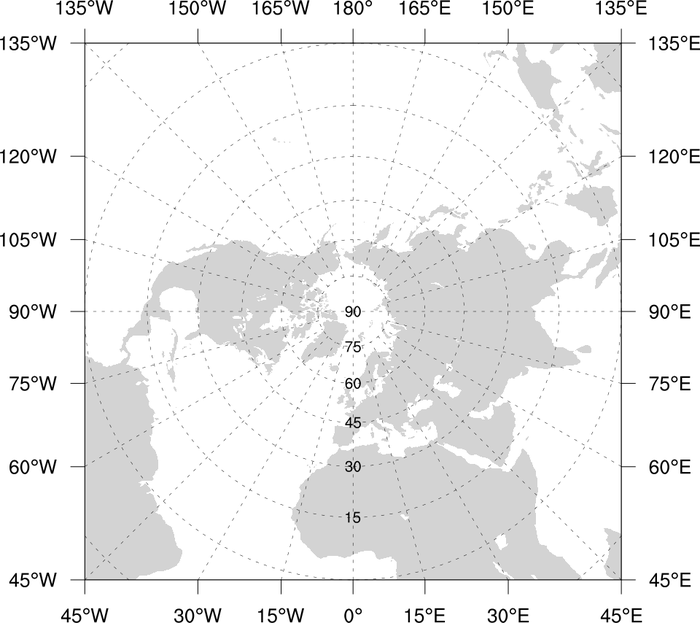
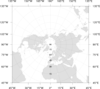 mapgrid_6.ncl
:
Shows how to add latitude labels to a stereographic map centered over
the north pole. Note that the tickmark labels only show longitude
locations. The latitude labels are attached
using
gsn_add_text.
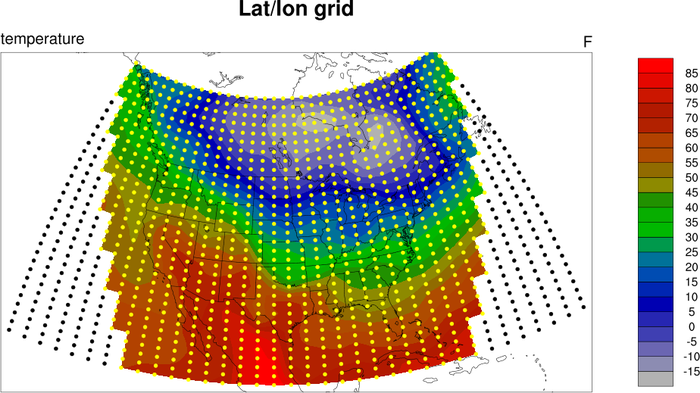
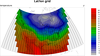 mapgrid_8.ncl
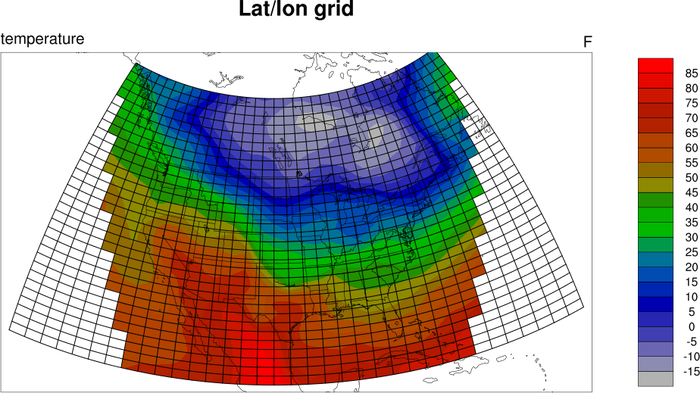
:
Draws a lat/lon grid over an existing plot using
gsn_coordinates.
The grid is first drawn using markers, to show the locations
of missing and non-missing data, and then it is drawn as lines.