NCL Home>
Application examples>
Special plots ||
Data files for some examples
 meteo_1.ncl:
Demonstrates a how to create a meteogram.
meteo_1.ncl:
Demonstrates a how to create a meteogram.
 meteo_2.ncl:
The same as meteo_1.ncl except that the x-axes are attached using the graphical resource:
gsnAttachPlotsXAxis.
meteo_2.ncl:
The same as meteo_1.ncl except that the x-axes are attached using the graphical resource:
gsnAttachPlotsXAxis.
Example pages containing:
tips |
resources |
functions/procedures
NCL Graphics: Meteogram
A meteogram is a graphical presentation of one or more meteorological variables with respect to time,
whether observed or forecast, for a particular location.
There is no rigid definition of which variables must be included. Two examples are the
Wikipedia Meteogram
and the GrADS Meteogram.
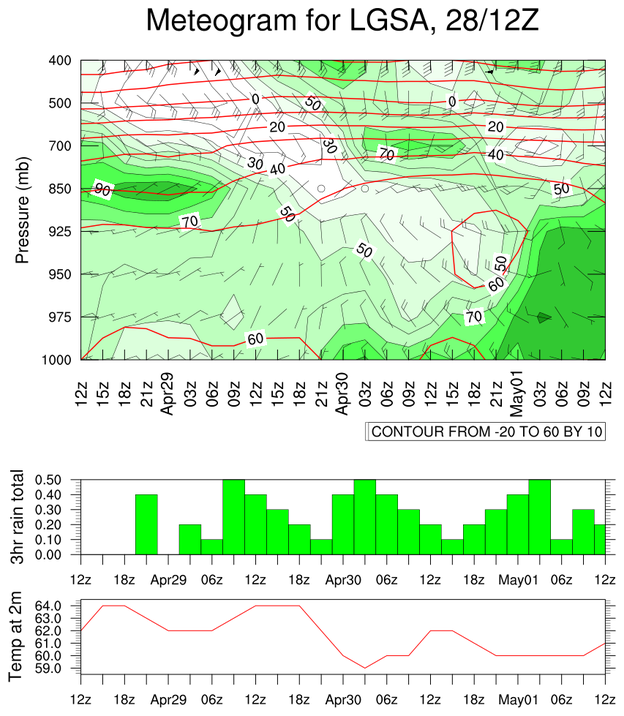
 meteo_1.ncl:
Demonstrates a how to create a meteogram.
meteo_1.ncl:
Demonstrates a how to create a meteogram.
This meteogram consists of five plots. The first three are overlaid onto each other and the last two are separate. It is necessary to treat each plot separately with its own resource list. Since each of the resulting three plots is of different sizes, they can not be panelled using gsn_panel. Instead, their positions are hard-wired using coordinates and height and width information.
A Python version of the scatter plot projection is available here.
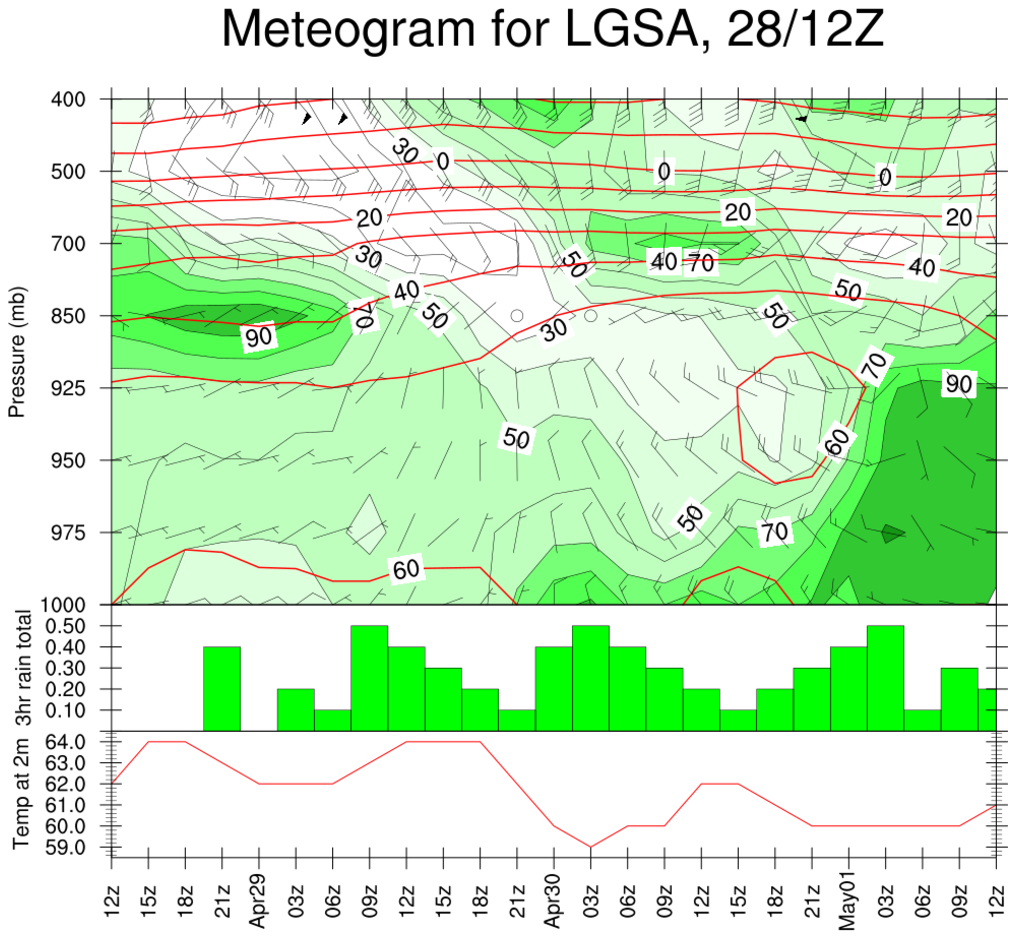 meteo_2.ncl:
The same as meteo_1.ncl except that the x-axes are attached using the graphical resource:
gsnAttachPlotsXAxis.
meteo_2.ncl:
The same as meteo_1.ncl except that the x-axes are attached using the graphical resource:
gsnAttachPlotsXAxis.