NCL Home>
Application examples>
Data sets ||
Data files for some examples
Example pages containing:
tips |
resources |
functions/procedures
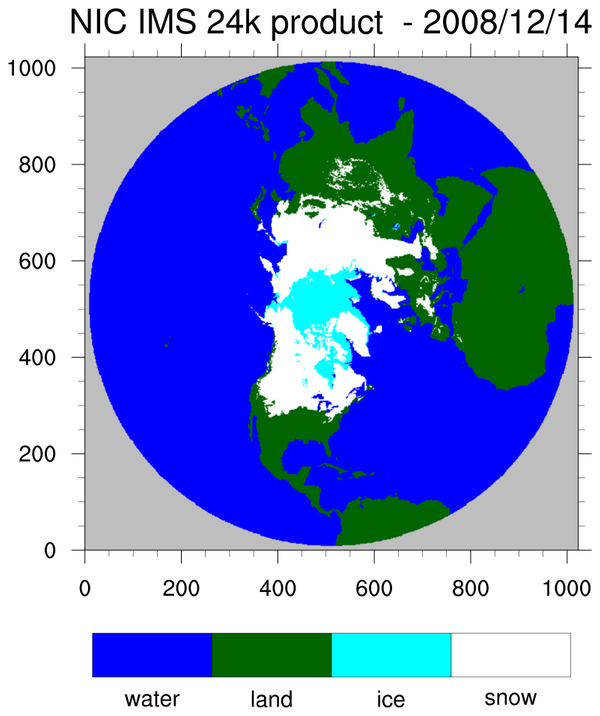
NIC IMS Snow and Ice Products
This page shows how to use NCL to display
IMS Snow and Ice products
from the National Ice Center. IMS is the
Interactive Multisensor Snow and Ice Mapping System.
According to the description of the data grid at
http://nsidc.org/data/docs/noaa/g02156_ims_snow_ice_analysis
use of this data should be acknowledged and cited as follows:
National Ice Center. 2008, updated daily.
IMS daily Northern Hemisphere snow and ice analysis at 4 km and 24 km resolution.
Boulder, CO: National Snow and Ice Data Center. Digital media.
 nic_ims_1.ncl
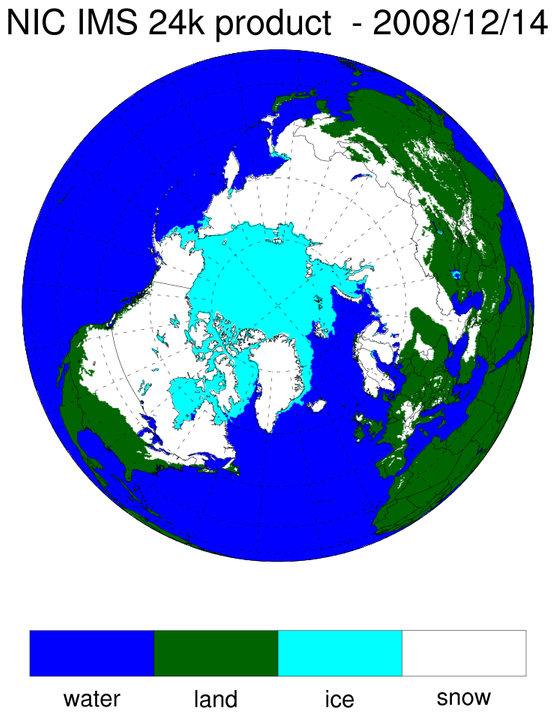
:
This script illustrates how to read and plot ascii data
from the NIC IMS, specifically a sample file from the 24 km Daily Northern Hemisphere Snow and Ice Analysis.
It represents snow and ice extent for one day in
December, 2008 over the northern hemisphere.
The first frame is a contour plot only, and the second frame overlays the
contours on a northern hemisphere polar stereographic map. This is the
native projection of the data and with a little messaging, which is explained
more fully in the comments within the code, the data can be drawn efficiently
with no reprojection required using the
tfDoNDCOverlay resource
set to True. The map projection resources must be set to match the data's native projection.
The first two plots do not require the associated coordinate data,
but the third frame draws the plot again using an orthographic projection. In
this case, the coordinate data must be provided in order to allow for arbitrary
reprojection. Here they are set using the sfXArray and
sfYArray resources. This kind of plot is usually
best rendered with the resource trGridType set to "TriangularMesh". In fact if
the coordinate data contains missing values, as in this case, it is the only
method that will work. It is also important to ensure that the data values also
are set to missing values wherever the coordinate values are missing. That is
because the triangular mesh plotting code discards triangles with missing data values
but it does not recognize missing values in the coordinate arrays.
You can retrieve the whole series of data from ftp://sidads.colorado.edu/pub/DATASETS/NOAA/G02156/24km. The
lat/lon grids are in binary and may be found at ftp://sidads.colorado.edu/pub/DATASETS/NOAA/G02156/metadata.

