How these scripts work
Each script is a stand alone entity that produces a particular
type of plot, vector only, contour only, vectors on contours, panels
etc. Your first task is to determine what type of plot you want. All
of the scripts are located in:
"/u/NOGAPS/NCLscripts".
At the top of each script, is an area where the user is allowed to make selections, such as which variables, which periods etc. to plot. These are your scripts, so you certainly are allowed to change the underlying NCL code. The current format was designed so that non-NCL users can use the scripts.
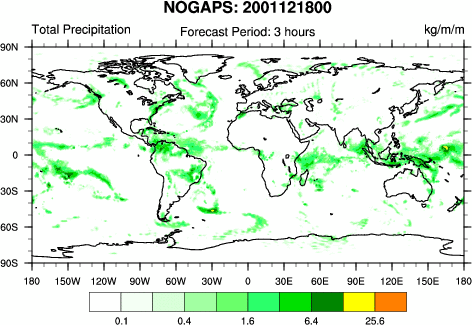
The following is an example of the user's parameters for the contour only script
    ;*****************************************************
    ; User's parameters
    ;*****************************************************
     date       = "2001121800"
     period     = (/3/)
           ; keep (/.../) syntax even if only one period chosen
           ; can be 0(analysis)3,6,9,12,15,18,21,24,27,30,33,
           ; 36,39, 42, 45, 48, 51, 54, 57, 60, 63, 66, 69, 72

     var_name   = "ttl_prcp"
	   ; "pres","dwpt_dprs","vpr_pres"
           ; "snsb_heat_flux", "snsb_ltnt_heat_flux"
           ; "ir_flux","ttl_heat_flux","ir_flux"
           ; "ttl_prcp","sol_rad"
           ; "grnd_sea_temp", "air_temp"

   ; -1 means let NCL determine range of data. Note fluxes have
   ; hard-wired ranges to ensure colormap centered on zero.
    mincn      =  -1        ; min contour
    maxcn      =  -1        ; max contour
    cnint      =  -1        ; contour interval
   ;
    linesOn    = False      ; turn on contour lines
    centerLon  = 0          ; choose any value
    output     = "ps"       ; "ps","eps","epsi","x11","ncgm","pdf"
All these scripts call
func_nogaps.ncl


