NCOM = Navy Coastal Ocean Model
http://www7320.nrlssc.navy.mil/global_ncom/
NCL Home>
Application examples>
Models ||
Data files for some examples
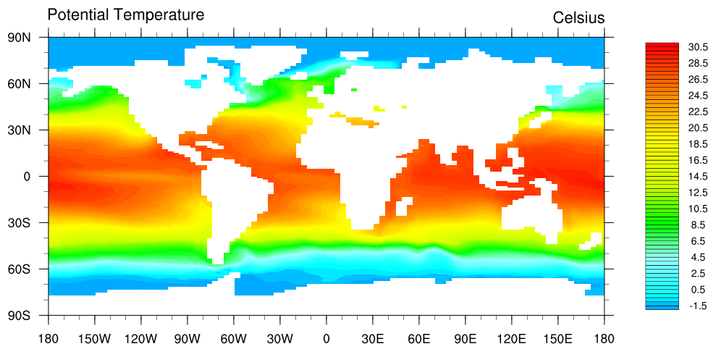
 ocean_1.ncl: Takes advantage of land
being set the missing to plot the land as the mask used by the ocean
model. If you were to plot T(0,20,:,:), you would see significantly
more land.
ocean_1.ncl: Takes advantage of land
being set the missing to plot the land as the mask used by the ocean
model. If you were to plot T(0,20,:,:), you would see significantly
more land.
cnFillOn = True, Turns on the color fill.
mpFillOn = False, Turns off the gray continents.
mpOutlineOn = False, Turns off the continental outline.
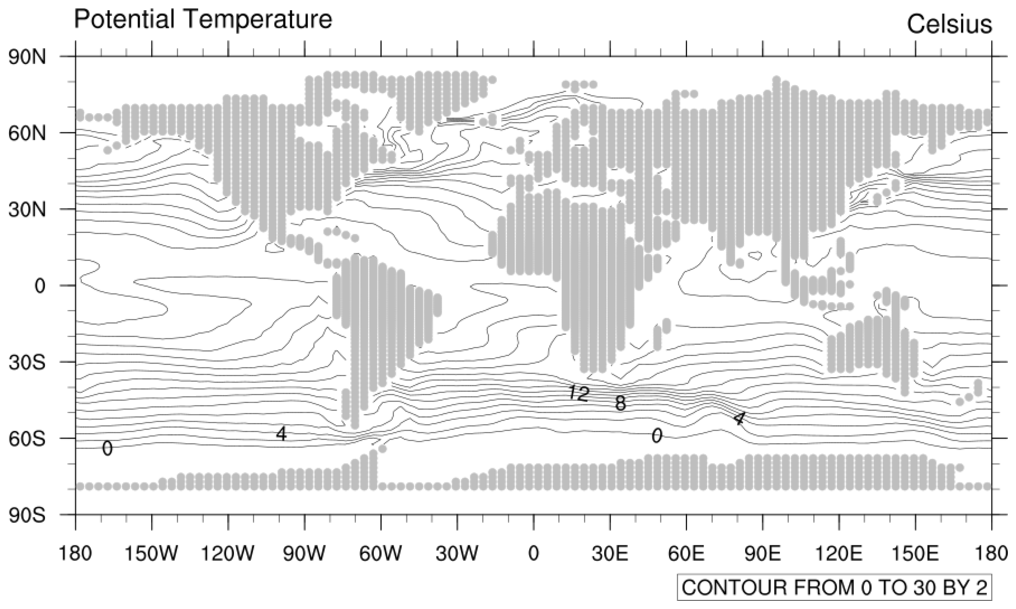
 ocean_2.ncl: Plots contour
lines and uses a polymarker to fill in the continental land mask
based upon the rmask=0 value. Using rmask for the land mask
works only for the surface.
ocean_2.ncl: Plots contour
lines and uses a polymarker to fill in the continental land mask
based upon the rmask=0 value. Using rmask for the land mask
works only for the surface.
indexes=(/0/)
rmask=in->rmask(:,{0:360})
Chooses which rmask value to draw, reads in the rmask array. If the cyclic point is removed from the lon_t array, it must also be removed here.
ndtooned converts a multi-dimensional array to a single dimension.
ind returns the indexes of the input where it is True.
inds = ind(ndtooned(rmask).eq.indexes) Uses the above two functions to pull out the indexes in a one-dimensional sense, where rmask equals land.
Some of the marker resources used in this example:
gsMarkerIndex =16, filled circle
gsMarkerSizeF = 7.0, marker size
gsMarkerColor= "gray"
gsn_polymarker plots the polymarkers
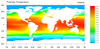
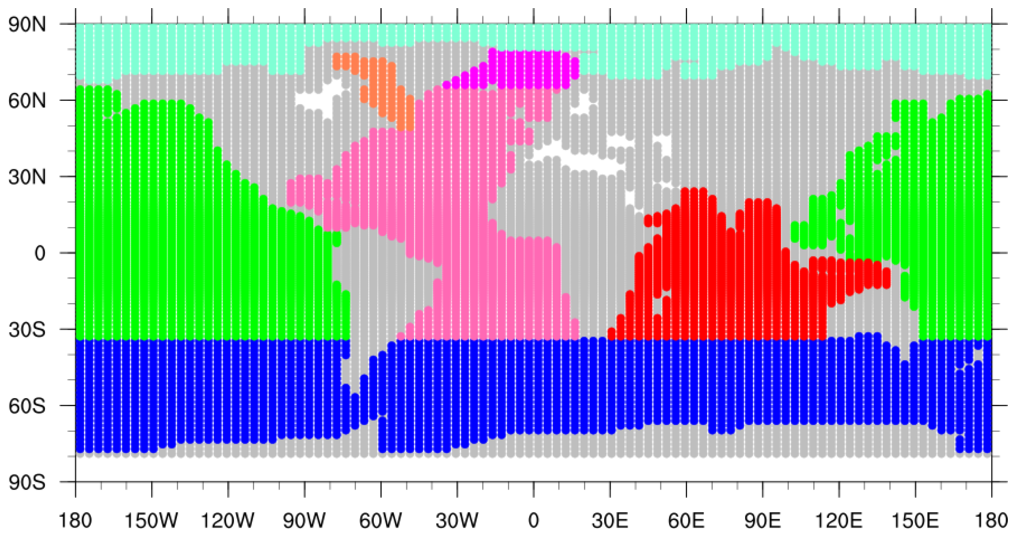
 ocean_3.ncl: Uses rmask and
polymarkers to draw the masks for the different ocean areas.
ocean_3.ncl: Uses rmask and
polymarkers to draw the masks for the different ocean areas.
indexes = (/0,1,2,3,6,8,9,10/)
colors =
(/"gray","blue","green","red","hotpink","coral","magenta","aquamarine"/)
Chooses which basins to plot and in which color. Other named colors are available.
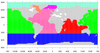
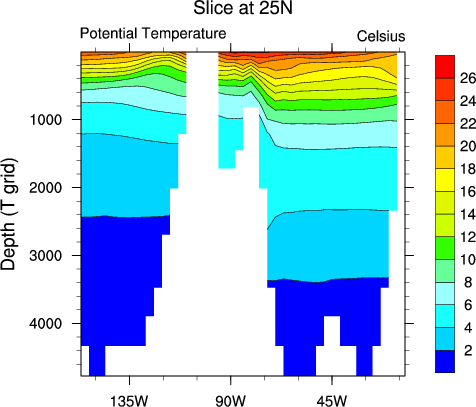
 ocean_4.ncl: Plots an oceanic
slice across the Atlantic at 25N with a default label bar.
ocean_4.ncl: Plots an oceanic
slice across the Atlantic at 25N with a default label bar.
cnLineLabelsOn = False, Turns off contour line labels.
cnInfoLabelOn = False, Turns off the contour information label.
gsnYAxisIrregular2Linear = True, Converts the irregular z-axis to linear.
trYReverse = True, Reverses the y-axis.
pmLabelBarDisplayMode = "Always", Turns on the label bar when using gsn_contour. When using gsn_csm_contour, the label bar is the default.
sfXArray = lon_t
sfYArray = z_t/100, Uses the lon/depth arrays for the plot axis.
Example pages containing: tips | resources | functions/procedures
NCL Graphics: NCOM Ocean Model
ocean_1.ncl: Takes advantage of land
being set the missing to plot the land as the mask used by the ocean
model. If you were to plot T(0,20,:,:), you would see significantly
more land.
cnFillOn = True, Turns on the color fill.
mpFillOn = False, Turns off the gray continents.
mpOutlineOn = False, Turns off the continental outline.
 ocean_2.ncl: Plots contour
lines and uses a polymarker to fill in the continental land mask
based upon the rmask=0 value. Using rmask for the land mask
works only for the surface.
ocean_2.ncl: Plots contour
lines and uses a polymarker to fill in the continental land mask
based upon the rmask=0 value. Using rmask for the land mask
works only for the surface.
indexes=(/0/)
rmask=in->rmask(:,{0:360})
Chooses which rmask value to draw, reads in the rmask array. If the cyclic point is removed from the lon_t array, it must also be removed here.
ndtooned converts a multi-dimensional array to a single dimension.
ind returns the indexes of the input where it is True.
inds = ind(ndtooned(rmask).eq.indexes) Uses the above two functions to pull out the indexes in a one-dimensional sense, where rmask equals land.
Some of the marker resources used in this example:
gsMarkerIndex =16, filled circle
gsMarkerSizeF = 7.0, marker size
gsMarkerColor= "gray"
gsn_polymarker plots the polymarkers
 ocean_3.ncl: Uses rmask and
polymarkers to draw the masks for the different ocean areas.
ocean_3.ncl: Uses rmask and
polymarkers to draw the masks for the different ocean areas.
indexes = (/0,1,2,3,6,8,9,10/)
colors =
(/"gray","blue","green","red","hotpink","coral","magenta","aquamarine"/)
Chooses which basins to plot and in which color. Other named colors are available.
 ocean_4.ncl: Plots an oceanic
slice across the Atlantic at 25N with a default label bar.
ocean_4.ncl: Plots an oceanic
slice across the Atlantic at 25N with a default label bar.
cnLineLabelsOn = False, Turns off contour line labels.
cnInfoLabelOn = False, Turns off the contour information label.
gsnYAxisIrregular2Linear = True, Converts the irregular z-axis to linear.
trYReverse = True, Reverses the y-axis.
pmLabelBarDisplayMode = "Always", Turns on the label bar when using gsn_contour. When using gsn_csm_contour, the label bar is the default.
sfXArray = lon_t
sfYArray = z_t/100, Uses the lon/depth arrays for the plot axis.