NCL Home>
Application examples>
gsn_csm graphical interfaces ||
Data files for some examples
 phase_1.ncl:
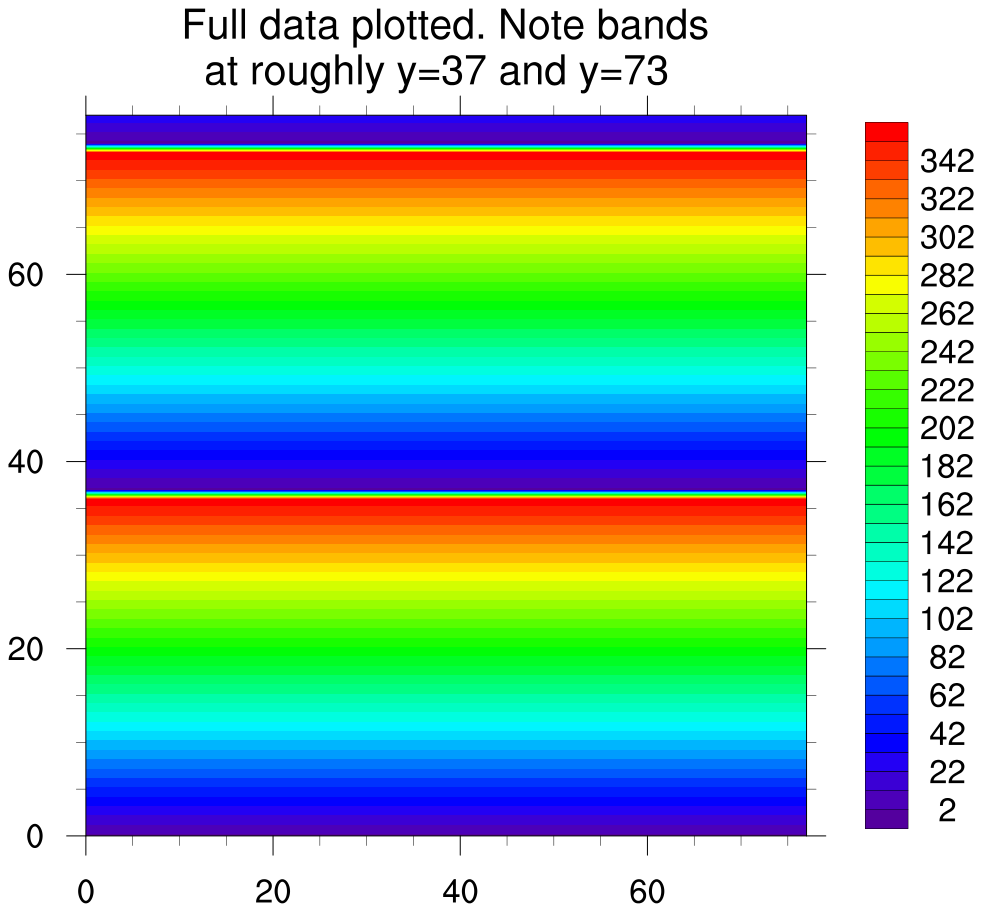
This example shows one method for drawing a "phased" contour plot such
that it doesn't draw a bunch of contour lines at the point where the
data is cyclic.
phase_1.ncl:
This example shows one method for drawing a "phased" contour plot such
that it doesn't draw a bunch of contour lines at the point where the
data is cyclic.
Example pages containing:
tips |
resources |
functions/procedures
NCL Graphics: Phased contours
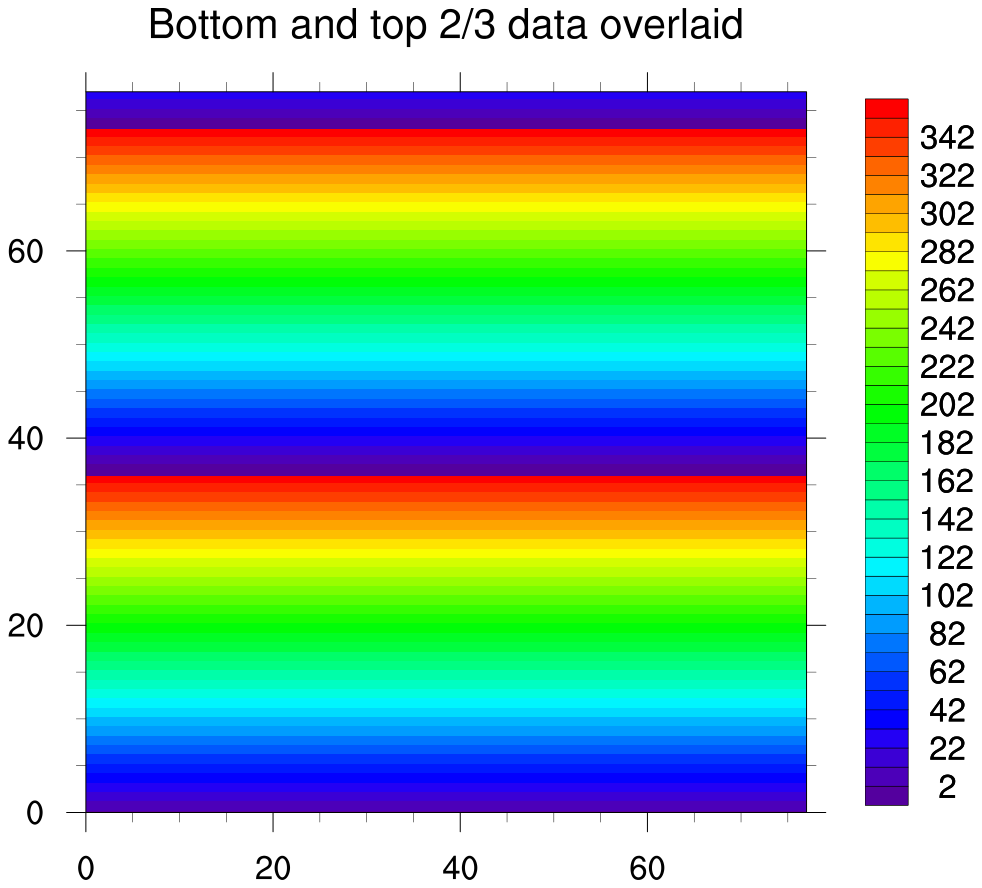
These examples demonstrate the how to plot data that is
"phased" or cyclic.
 phase_1.ncl:
This example shows one method for drawing a "phased" contour plot such
that it doesn't draw a bunch of contour lines at the point where the
data is cyclic.
phase_1.ncl:
This example shows one method for drawing a "phased" contour plot such
that it doesn't draw a bunch of contour lines at the point where the
data is cyclic.
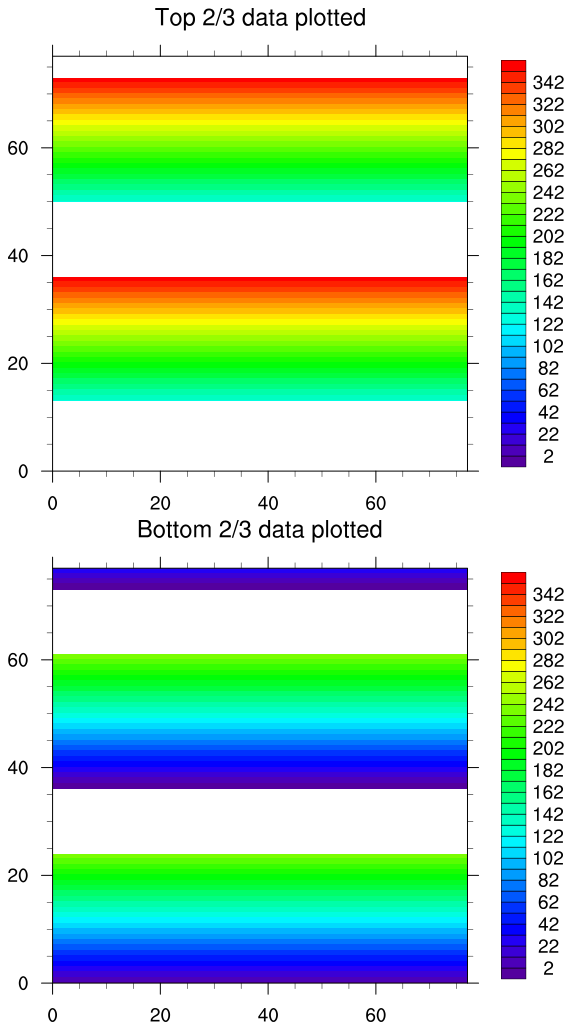
This method creates a contour plot of the upper two-thirds of the data, and the bottom two-thirds of the data with the maximum values set to -1. This prevents the banding at the cyclic point. The overlay procedure is then used to overlay the two plots.