Example pages containing:
tips |
resources |
functions/procedures
NCL Graphics: Station Data
 station_1.ncl /
station_old_1.ncl /
The data file for this example
is pw.dat, which contains a column of
data values, each with a corresponding lat, lon value.
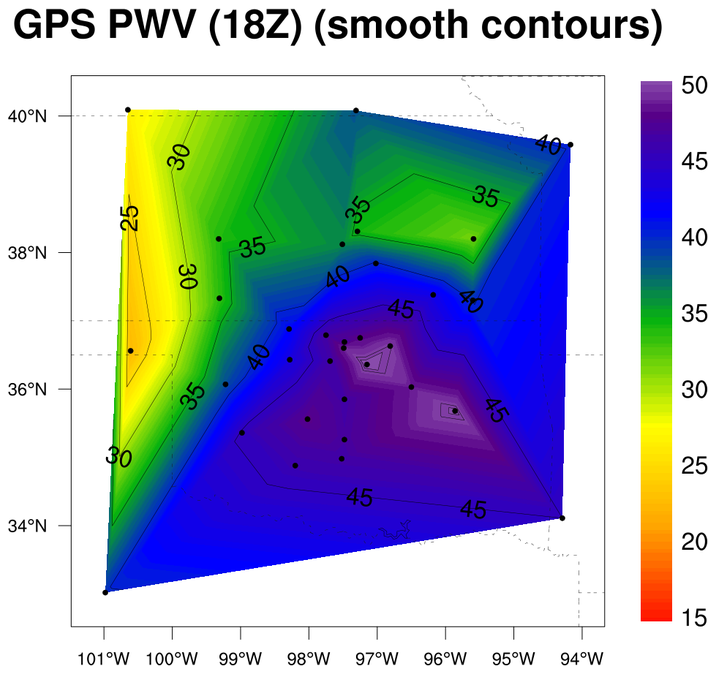
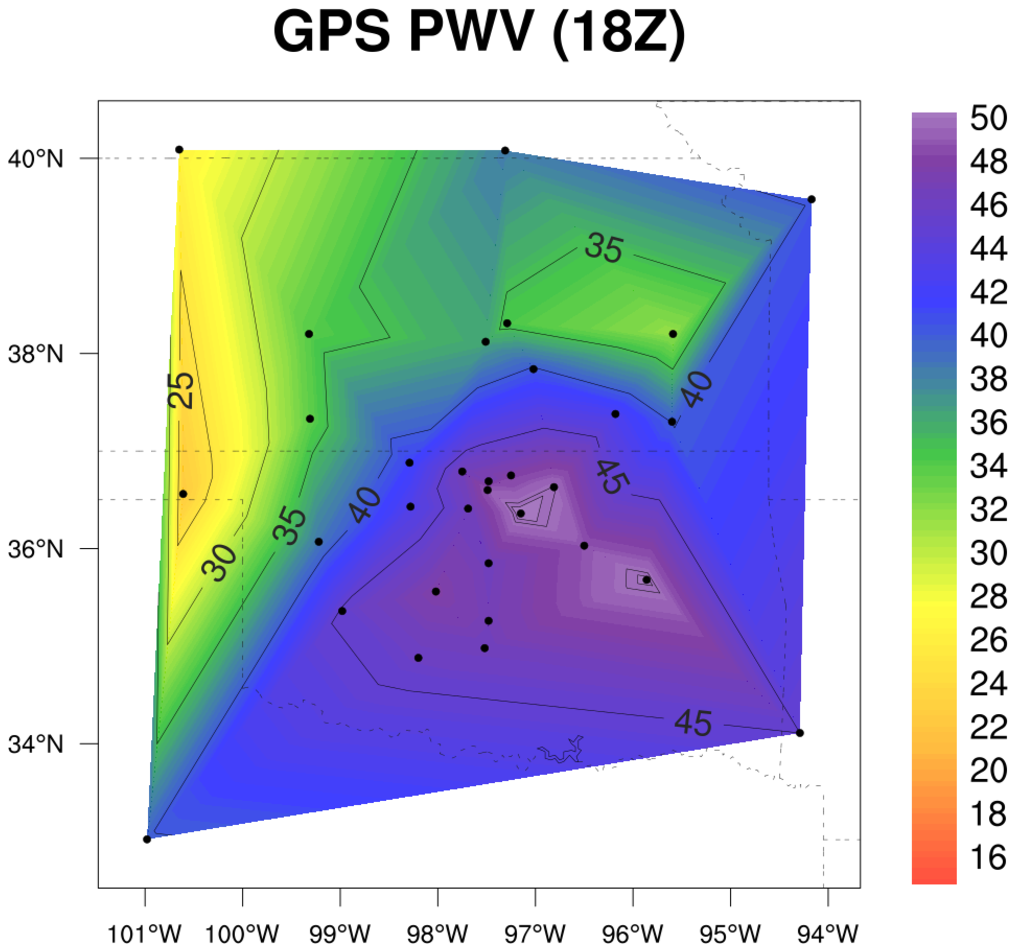
station_1.ncl /
station_old_1.ncl /
The data file for this example
is pw.dat, which contains a column of
data values, each with a corresponding lat, lon value.
In order to contour this data over a map, this script attaches the 1D lat/lon arrays to the data using special "lat1d" and "lon1d" attributes. As of NCL V6.4.0, the gsn_csm_xxxxx_map scripts will look for these special attributes in order to correctly plot the data over a map. See the "station_old_1.ncl" script if you have an older version of NCL that doesn't recognize the lat1d/lon1d attributes.
Since there are a lot of contour levels in this example, the cnLevelFlags resource is used to control which contour lines are actually drawn.
See example 1 on the "Contouring random data" page for a similar example using the same data, which compare smooth contours with raster contours.
 station_2.ncl:
This example shows how to plot values at station locations using
different colors and marker sizes for each station point. The station
values are grouped depending on which range of values they fall in,
and then every marker in this group gets the same color and size.
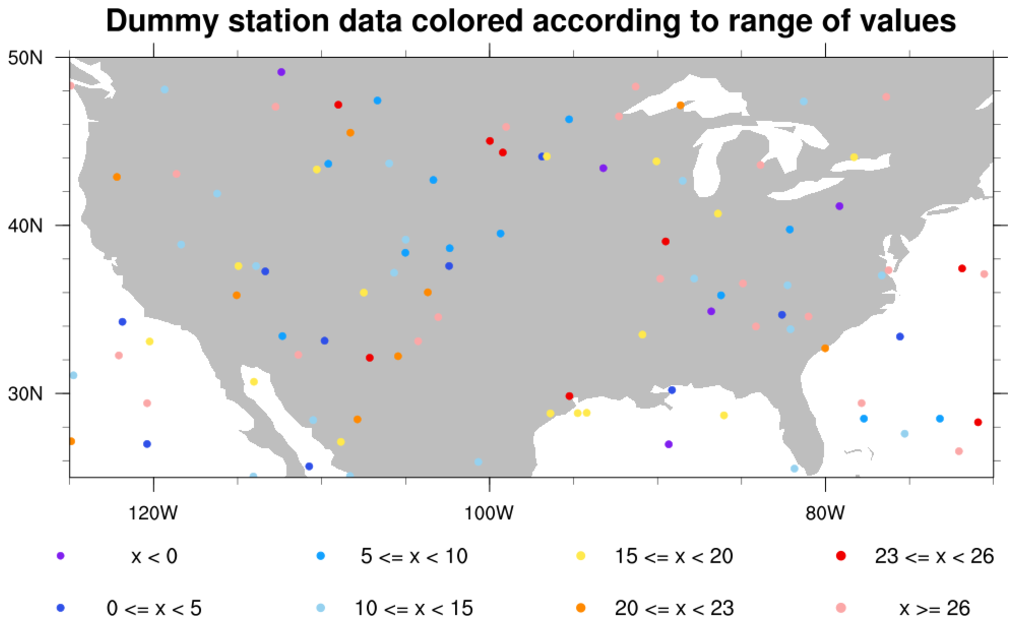
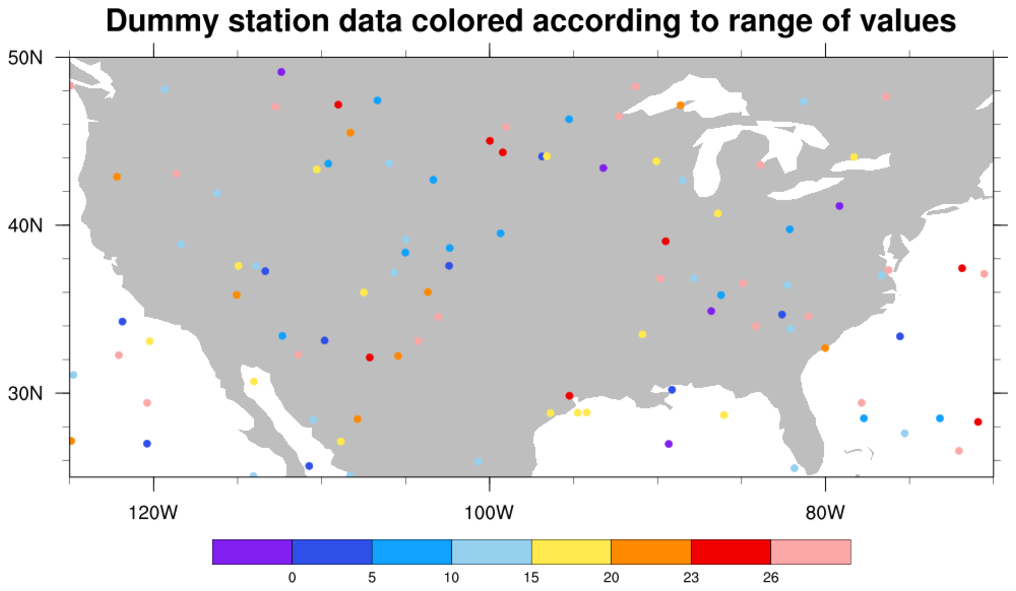
station_2.ncl:
This example shows how to plot values at station locations using
different colors and marker sizes for each station point. The station
values are grouped depending on which range of values they fall in,
and then every marker in this group gets the same color and size.
Two plots are created: one with a legend at the bottom, using calls to gsn_polymarker and gsn_text_ndc, and one with a labelbar at the bottom, using calls to calls to gsn_create_labelbar and gsn_add_annotation,
A Python version of this projection is available here.
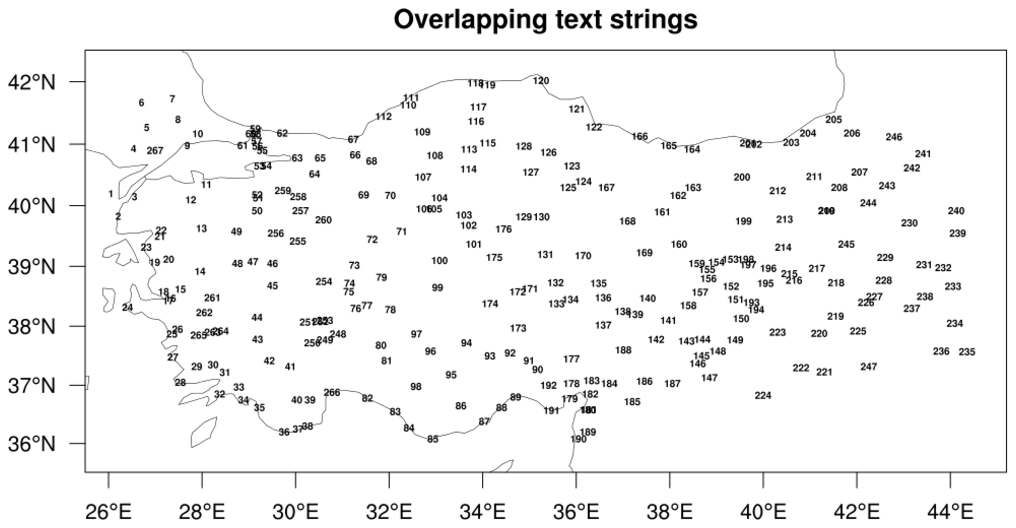
 station_3.ncl: This example shows how
to use gsn_add_text to add lots of
strings to a map plot, and then how to determine which ones overlay
other strings so you can remove them.
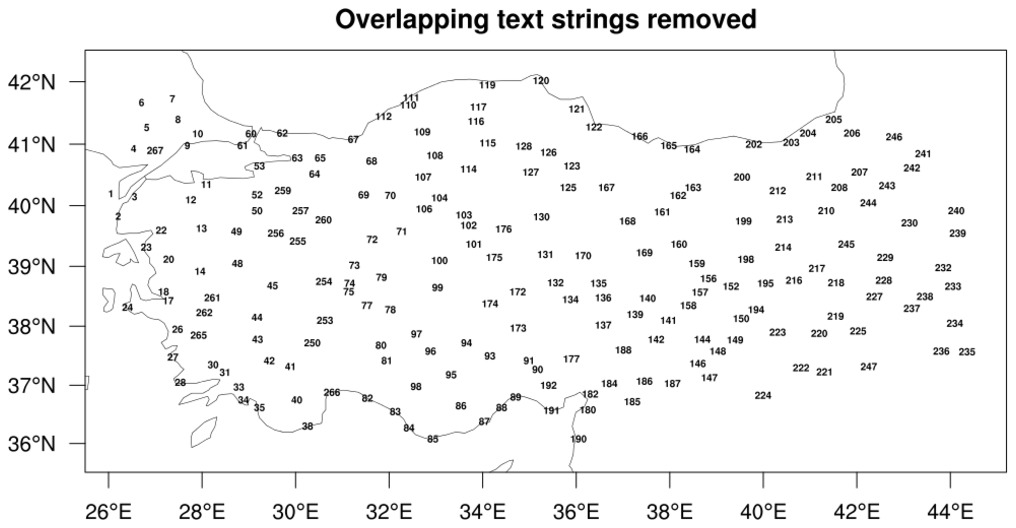
station_3.ncl: This example shows how
to use gsn_add_text to add lots of
strings to a map plot, and then how to determine which ones overlay
other strings so you can remove them.
You can download the small istasyontablosu_son.txt data file for this example. Thanks to Ozan Mert Gokturk for providing the data file and the inspiration for this example.
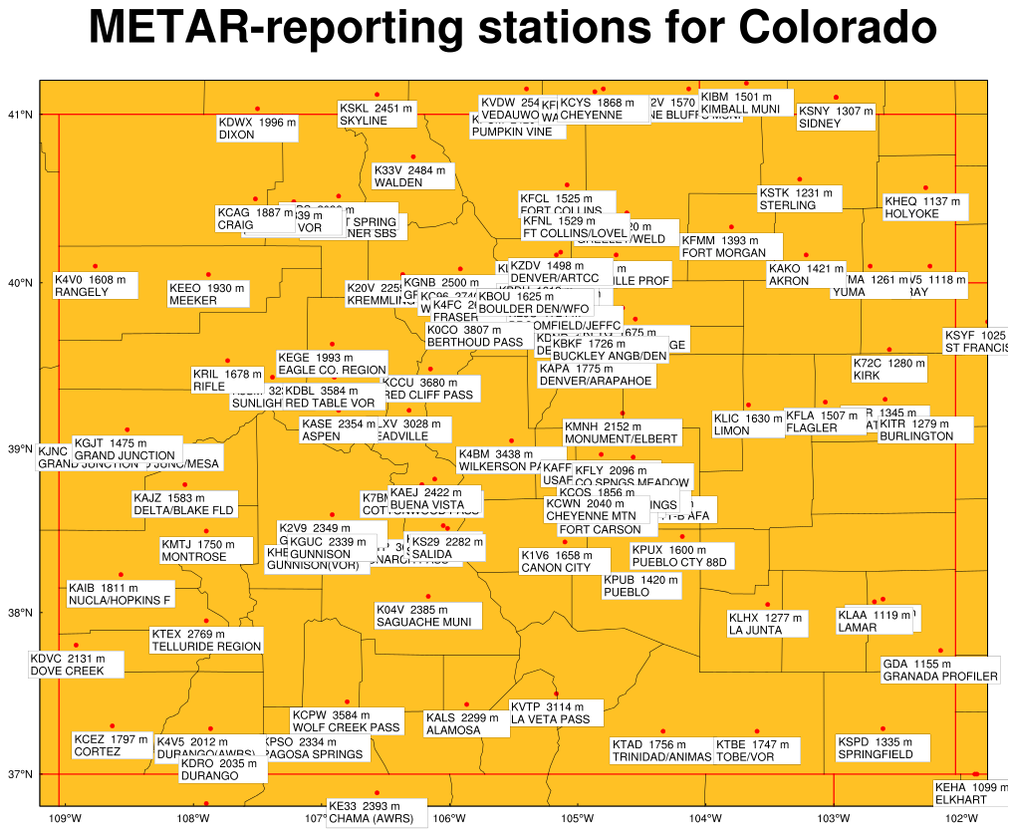 station_4.ncl: This example shows how
to plot all METAR reporting stations for a specified region.
station_4.ncl: This example shows how
to plot all METAR reporting stations for a specified region.
This script takes general input from the "stations.txt" file available from the Research Applications Laboratory Weather Page at: http://www.rap.ucar.edu/weather/surface/stations.txt.
This script was written by Jonathan Vigh of NCAR.