NCL Home>
Application examples>
Plot techniques ||
Data files for some examples
 tm_1.ncl:
Simple XY plot with a set plot size and a set range for both the X and Y axis.
tm_1.ncl:
Simple XY plot with a set plot size and a set range for both the X and Y axis.
 tm_2.ncl:
Demonstrates how to specify tick mark labels and minor tick marks.
tm_2.ncl:
Demonstrates how to specify tick mark labels and minor tick marks.
 tm_3.ncl:
Shows how to remove axis borders, tick marks, and tick mark labels. Demonstrates how
to adjust the font height of tick mark labels.
tm_3.ncl:
Shows how to remove axis borders, tick marks, and tick mark labels. Demonstrates how
to adjust the font height of tick mark labels.
 tm_horz_3.ncl:
This example is similar to tm_3.ncl, except it shows how to draw the
bars horizontally, by setting:
tm_horz_3.ncl:
This example is similar to tm_3.ncl, except it shows how to draw the
bars horizontally, by setting:
 tm_4.ncl:
Demonstrates how to change the formatting and precision of tick mark labels.
tm_4.ncl:
Demonstrates how to change the formatting and precision of tick mark labels.
 tm_5.ncl:
Demonstrates how to reverse the Y-axis, and change the angle, position, and color of tick mark labels.
tm_5.ncl:
Demonstrates how to reverse the Y-axis, and change the angle, position, and color of tick mark labels.
 tm_6.ncl:
Shows how to format the two Y-axis differently, how to alter the appearance of the tick marks, and how
to move the Y-axis title to the righthand side of the plot.
tm_6.ncl:
Shows how to format the two Y-axis differently, how to alter the appearance of the tick marks, and how
to move the Y-axis title to the righthand side of the plot.
 tm_7.ncl:
Shows how to set the Y-axis to a logorithmic scale, and how to set the tick mark labeling interval.
tm_7.ncl:
Shows how to set the Y-axis to a logorithmic scale, and how to set the tick mark labeling interval.
 tm_8.ncl:
Shows the various ways you can change the formatting of the numeric
tickmark labels using the tmXXFormat resources. This example
just uses the tmXBFormat resource,
but note that the same format rules apply to other formatting
resources, like tmYLFormat, cnLineLabelFormat, vcScalarValueFormat, and any numeric
formatting resource ending in "Format".
tm_8.ncl:
Shows the various ways you can change the formatting of the numeric
tickmark labels using the tmXXFormat resources. This example
just uses the tmXBFormat resource,
but note that the same format rules apply to other formatting
resources, like tmYLFormat, cnLineLabelFormat, vcScalarValueFormat, and any numeric
formatting resource ending in "Format".
 tm_9.ncl:
Demonstrates how to label the right Y-axis differently than the left Y-axis. The first plot is drawn
with only the lefthand Y-axis tick mark labels. After gsn_csm_xy
is called, getvalues is used to retrieve the tmYLValues from
the plot. The tmYLValues are then used to locate the
tmYRValues / tmYRLabels. setvalues
allows you to modify a previously created plot by setting/modifying resources.
tm_9.ncl:
Demonstrates how to label the right Y-axis differently than the left Y-axis. The first plot is drawn
with only the lefthand Y-axis tick mark labels. After gsn_csm_xy
is called, getvalues is used to retrieve the tmYLValues from
the plot. The tmYLValues are then used to locate the
tmYRValues / tmYRLabels. setvalues
allows you to modify a previously created plot by setting/modifying resources.
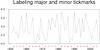 tm_10.ncl:
Demonstrates how to label both the minor and major tickmarks.
This particular method draws the same plot twice: the first time
labeling the major tickmarks, and the second time by treating
the minor tickmarks as major ones, and labeling those.
tm_10.ncl:
Demonstrates how to label both the minor and major tickmarks.
This particular method draws the same plot twice: the first time
labeling the major tickmarks, and the second time by treating
the minor tickmarks as major ones, and labeling those.
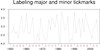 tm_11.ncl:
This example is identical to example 10, except it uses the function
gsn_blank_plot to create a new
tickmark object to overlay on the original plot. This method can be
faster than the previous one, especially if the initial plot is
time-consuming to create.
tm_11.ncl:
This example is identical to example 10, except it uses the function
gsn_blank_plot to create a new
tickmark object to overlay on the original plot. This method can be
faster than the previous one, especially if the initial plot is
time-consuming to create.

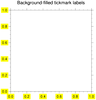 tm_12.ncl: This script shows how to
customize tickmarks by creating your own
using gsn_text_ndc. In this script,
the customized tickmarks are drawn with a background fill color of
yellow, which you cannot do with regular tickmark labels.
tm_12.ncl: This script shows how to
customize tickmarks by creating your own
using gsn_text_ndc. In this script,
the customized tickmarks are drawn with a background fill color of
yellow, which you cannot do with regular tickmark labels.
Example pages containing:
tips |
resources |
functions/procedures
NCL Graphics: Tick marks
In the following examples, the use of a resource is often demonstrated for only one of the
four axes. Most tick mark resources have similar versions for all 4 axes. Example 3, for instance,
demonstrates specifying the bottom X-axis tick mark label font height by setting
tmXBLabelFontHeightF. Similar resources exist for the other 3 axes:
tmYLLabelFontHeightF,
tmXTLabelFontHeightF, and tmYRLabelFontHeightF.
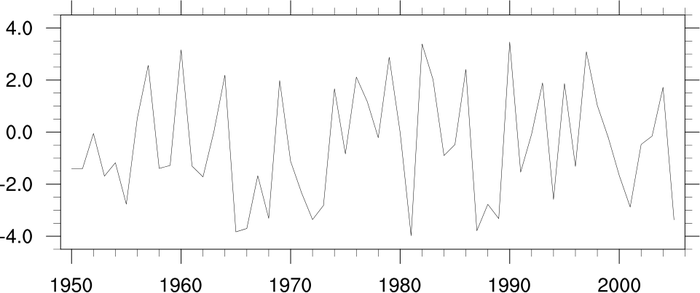
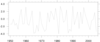
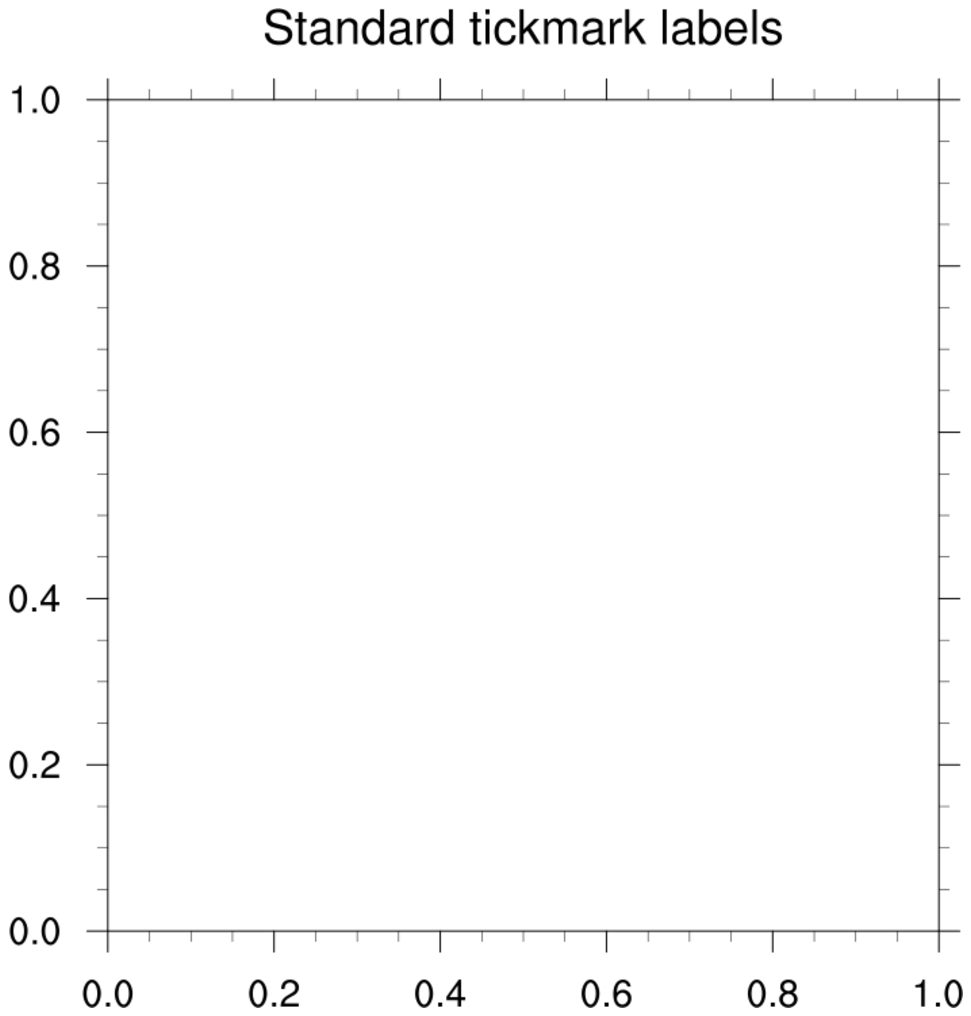
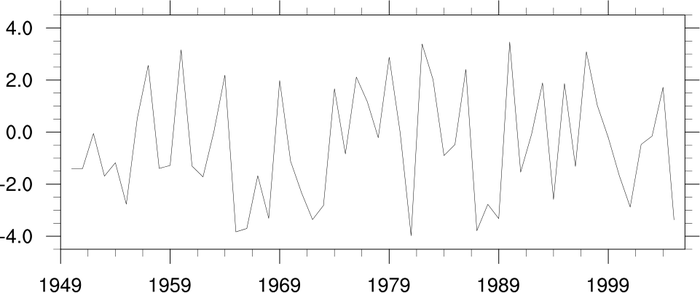 tm_1.ncl:
Simple XY plot with a set plot size and a set range for both the X and Y axis.
tm_1.ncl:
Simple XY plot with a set plot size and a set range for both the X and Y axis.
trYMinF, trYMaxF, trXMinF and trXMaxF allow the user to set the minimum Y-axis value, the maximum Y-axis value, the minimum X-axis value, and the maximum X-axis value.
vpWidthF (vpHeightF) allows the user to set the width (height) of the XY plot in NDC coordinates.
The second frame shows how to force the X-axis tickmark labeling to start on the first value, by setting tmXBMode to "Manual" and tmXBTickStartF to the minimum value of the X-axis.
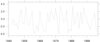
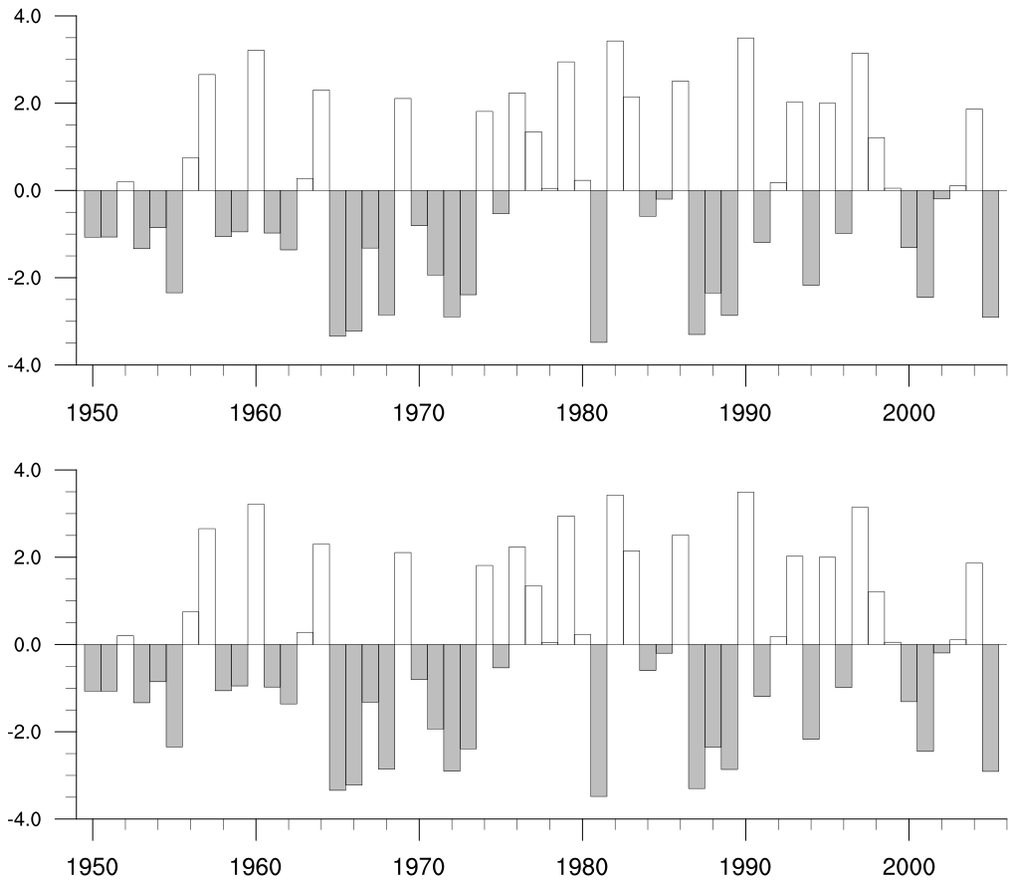
 tm_2.ncl:
Demonstrates how to specify tick mark labels and minor tick marks.
tm_2.ncl:
Demonstrates how to specify tick mark labels and minor tick marks.
By default, tmXBMode is set to Automatic, automatically generating the bottom X-axis tick mark labels. For the top panel, tmXBMode is set to Manual, tmXBTickStartF, tmXBTickStartF, and tmXBTickSpacingF are then used to manually set the bottom X-axis labels.
For the bottom panel, tmXBMode is set to Explicit, and tmXBValues and tmXBLabels are used to set the bottom X-axis labels. This setting allows the user to explicitly specify labels. Note, when tmXBMode is set to Explicit, the bottom X-axis minor tick marks are automatically removed. To explicitly specify what bottom X-axis minor tick marks are shown, tmXBMinorValues must be used.
A Python version of this projection is available here.
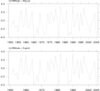
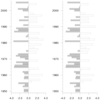
 tm_3.ncl:
Shows how to remove axis borders, tick marks, and tick mark labels. Demonstrates how
to adjust the font height of tick mark labels.
tm_3.ncl:
Shows how to remove axis borders, tick marks, and tick mark labels. Demonstrates how
to adjust the font height of tick mark labels.
(Top Panel) By setting tmYROn to False and tmYRBorderOn to False, the right Y-axis is completely turned off. (The right Y-axis and top X-axis labels are by default turned off.) The same is done to the top X-axis, using tmXTOn and tmXTBorderOn.
(Bottom Panel) tmXBLabelFontHeightF is used to set the bottom X-axis tick mark label font size, and tmYLLabelsOn is used to remove the left Y-axis tick mark labels.
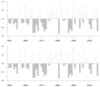
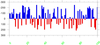
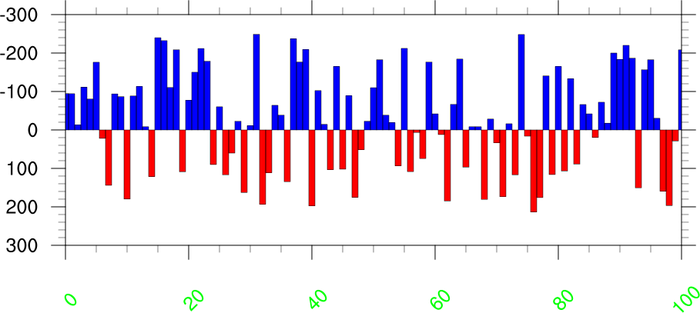
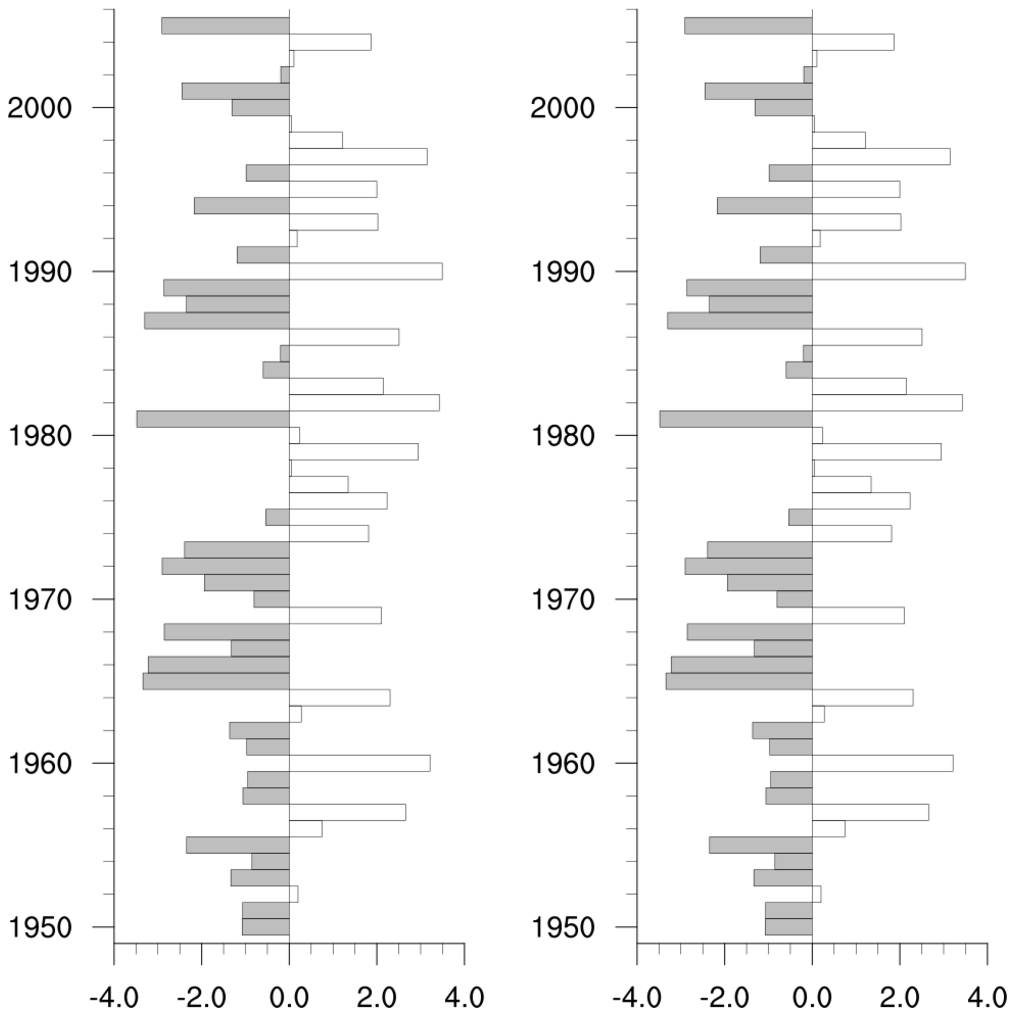 tm_horz_3.ncl:
This example is similar to tm_3.ncl, except it shows how to draw the
bars horizontally, by setting:
tm_horz_3.ncl:
This example is similar to tm_3.ncl, except it shows how to draw the
bars horizontally, by setting:
  res@gsnXRefLine = 0.
  res@gsnRightXRefLineColor = "White"
  res@gsnLeftXRefLineColor  = "Gray"
This capability is only available in NCL version 6.4.0 or later.
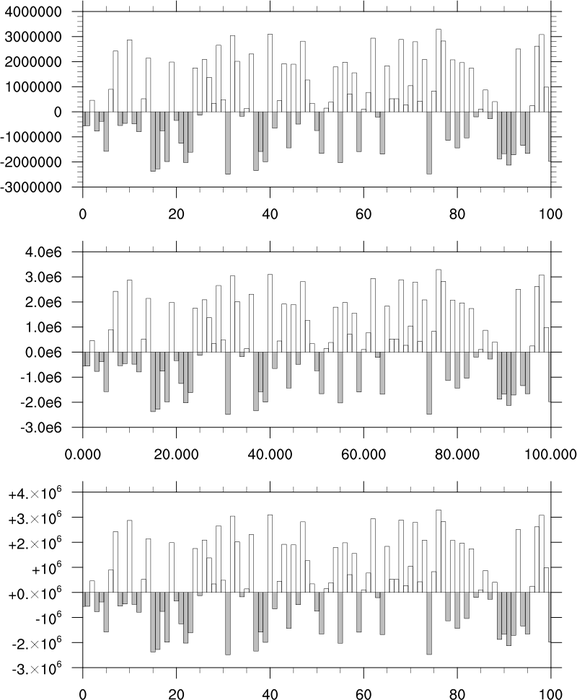 tm_4.ncl:
Demonstrates how to change the formatting and precision of tick mark labels.
tm_4.ncl:
Demonstrates how to change the formatting and precision of tick mark labels.
The top panel shows the default formatting of the left Y-axis and bottom X-axis. The default setting of tmYLFormat / tmXBFormat is "0@*+^sg". For an explanation of what this means, refer to documentation of the HLU Floating Point Format Specification scheme.
For the middle panel, tmYLFormat is set to "0*+^e", which forces use of the lower case exponential format (e) for the left Y-axis tick mark labels. The precision of the bottom X-axis labels is set by setting tmXBPrecision.
For the bottom panel, tmYLFormat is set to "#+^se". This results in the + labels being shown, and a format of "x10i". (Translation: # = force a trailing decimal point, + = must show plus signs, ^s = use exponential format x10i, e = use exponential format, lower case.)
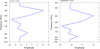
 tm_5.ncl:
Demonstrates how to reverse the Y-axis, and change the angle, position, and color of tick mark labels.
tm_5.ncl:
Demonstrates how to reverse the Y-axis, and change the angle, position, and color of tick mark labels.
trYReverse is used to reverse the Y-axis, tmXBLabelAngleF alters the angle of the bottom X-axis labels, tmXBLabelFontColor sets the color of the bottom X-axis labels, and tmXBLabelDeltaF sets the amount the bottom X-axis labels are offset from the plot.
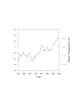
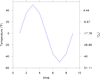
 tm_6.ncl:
Shows how to format the two Y-axis differently, how to alter the appearance of the tick marks, and how
to move the Y-axis title to the righthand side of the plot.
tm_6.ncl:
Shows how to format the two Y-axis differently, how to alter the appearance of the tick marks, and how
to move the Y-axis title to the righthand side of the plot.
tmYUseLeft is by default set to True, which automatically formats the the right Y-axis the same as the left Y-axis. By setting tmYUseLeft to False, the user is allowed to specify different formatting for the right Y-axis when compared to the left Y-axis. tmYRLabelFontColor can now be used to set the right Y-axis tick mark label font color, and tmYRPrecision can be used to set the precision of the right Y-axis tick mark labels. If tmYUseLeft was set to True, tmYRLabelFontColor and tmYRPrecision would have no effect.
tmXBMajorLengthF and tmXBMajorOutwardLengthF are used to set the total length and total outward length of the bottom X-axis major tick marks. In this case, they are set to the same value, 0.021, which means that the tick marks will be 0.021 NDC units long on the outside of the tick mark border. (If tmXBMajorOutwardLengthF was set to -0.021 the tick marks would be 0.021 NDC units long on the inside of the tick mark border.)
tmXBMinorLengthF and tmXBMinorOutwardLengthF work the same way, except for the bottom X-axis minor tick marks. In this case, tmXBMinorLengthF is set to 0.008, and tmXBMinorOutwardLengthF is set to 0.015. Thus, the bottom X-axis minor tick marks will start at 0.015 NDC units away from the tick mark border, and be 0.008 NDC units long, leaving some white space between the minor tick marks and the tick mark border.
tiYAxisSide is set to Right, moving the Y-axis label to the right hand side of the plot.
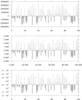
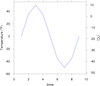
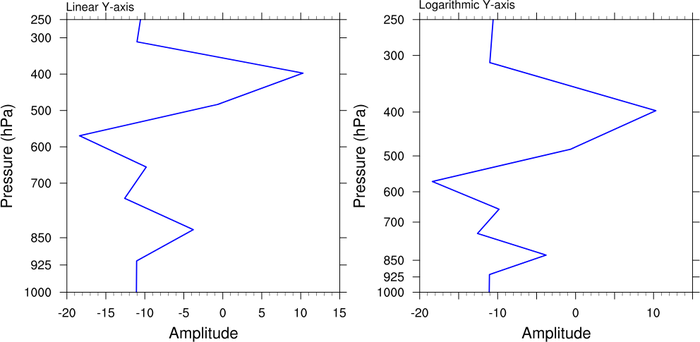 tm_7.ncl:
Shows how to set the Y-axis to a logorithmic scale, and how to set the tick mark labeling interval.
tm_7.ncl:
Shows how to set the Y-axis to a logorithmic scale, and how to set the tick mark labeling interval.
The left panel shows the default linear Y-axis, along with labels on every bottom X-axis major tick mark.
The right panel shows a logorithmic Y-axis, and labels on every other bottom X-axis major tick mark. The Y-axis scale is changed by setting trYLog to True, and the labeling interval of the bottom X-axis tick marks is set via tmXBLabelStride.
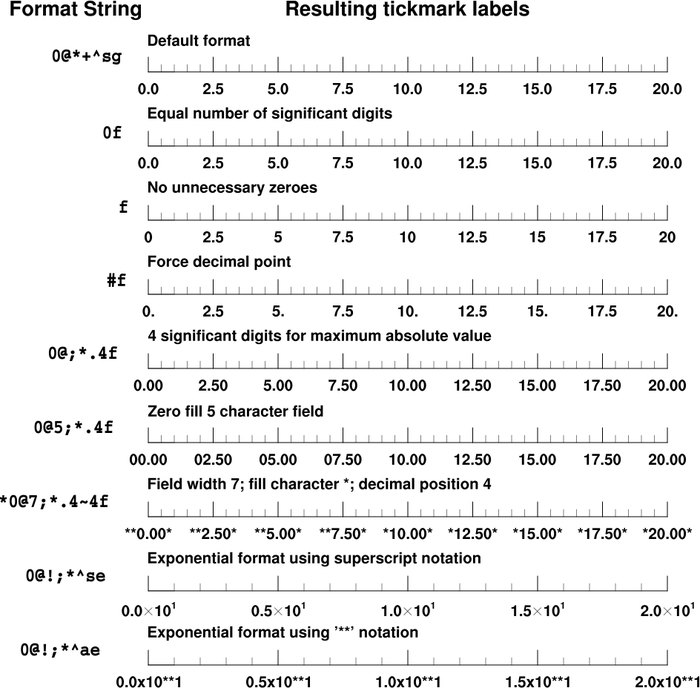 tm_8.ncl:
Shows the various ways you can change the formatting of the numeric
tickmark labels using the tmXXFormat resources. This example
just uses the tmXBFormat resource,
but note that the same format rules apply to other formatting
resources, like tmYLFormat, cnLineLabelFormat, vcScalarValueFormat, and any numeric
formatting resource ending in "Format".
tm_8.ncl:
Shows the various ways you can change the formatting of the numeric
tickmark labels using the tmXXFormat resources. This example
just uses the tmXBFormat resource,
but note that the same format rules apply to other formatting
resources, like tmYLFormat, cnLineLabelFormat, vcScalarValueFormat, and any numeric
formatting resource ending in "Format".
For more information on formatting numeric labels, see the format conversion specification strings section.
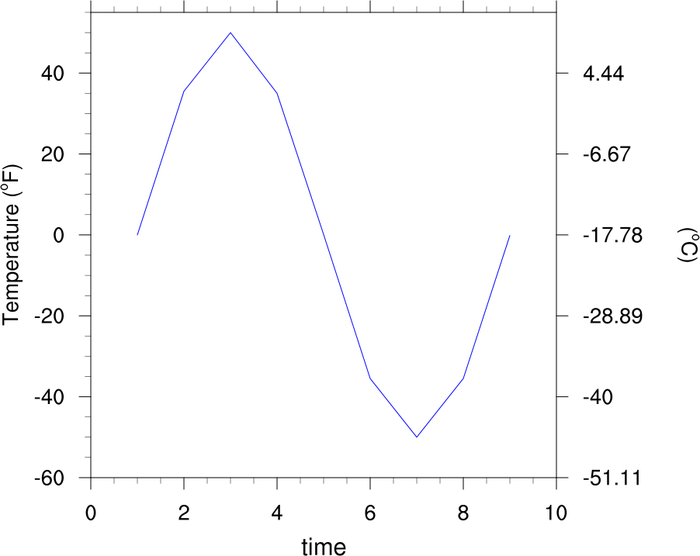
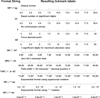
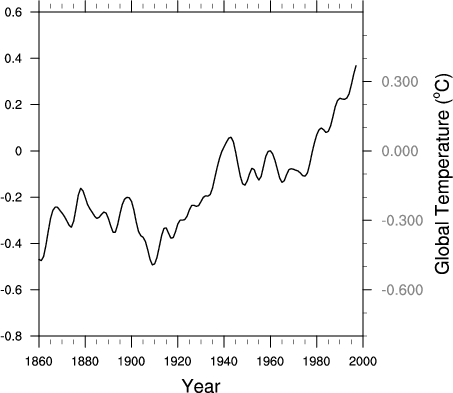
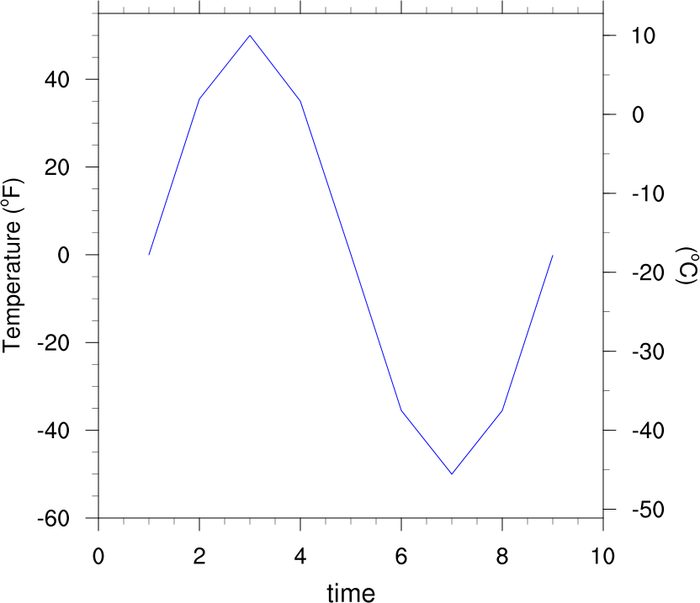 tm_9.ncl:
Demonstrates how to label the right Y-axis differently than the left Y-axis. The first plot is drawn
with only the lefthand Y-axis tick mark labels. After gsn_csm_xy
is called, getvalues is used to retrieve the tmYLValues from
the plot. The tmYLValues are then used to locate the
tmYRValues / tmYRLabels. setvalues
allows you to modify a previously created plot by setting/modifying resources.
tm_9.ncl:
Demonstrates how to label the right Y-axis differently than the left Y-axis. The first plot is drawn
with only the lefthand Y-axis tick mark labels. After gsn_csm_xy
is called, getvalues is used to retrieve the tmYLValues from
the plot. The tmYLValues are then used to locate the
tmYRValues / tmYRLabels. setvalues
allows you to modify a previously created plot by setting/modifying resources.
The Celsius labels on the righthand Y-axis of the first plot were automatically created based on the Fahrenheit labels from the lefthand Y-axis. This results in awkward Celsius labels. The second plot shows how to manually set "nice" Celsius labels, along with minor tickmarks for the righthand Y-axis.
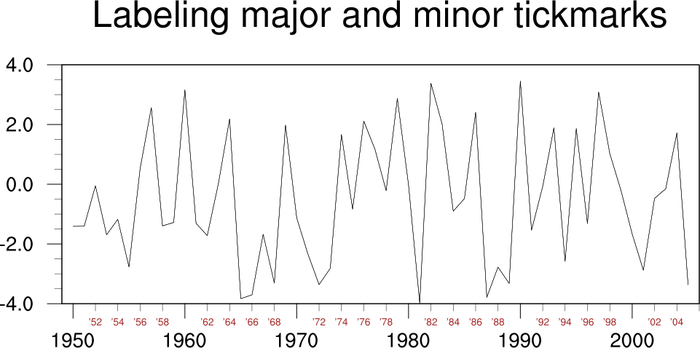 tm_10.ncl:
Demonstrates how to label both the minor and major tickmarks.
This particular method draws the same plot twice: the first time
labeling the major tickmarks, and the second time by treating
the minor tickmarks as major ones, and labeling those.
tm_10.ncl:
Demonstrates how to label both the minor and major tickmarks.
This particular method draws the same plot twice: the first time
labeling the major tickmarks, and the second time by treating
the minor tickmarks as major ones, and labeling those.
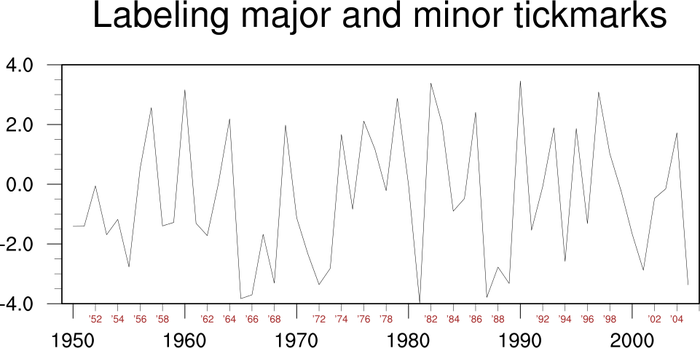 tm_11.ncl:
This example is identical to example 10, except it uses the function
gsn_blank_plot to create a new
tickmark object to overlay on the original plot. This method can be
faster than the previous one, especially if the initial plot is
time-consuming to create.
tm_11.ncl:
This example is identical to example 10, except it uses the function
gsn_blank_plot to create a new
tickmark object to overlay on the original plot. This method can be
faster than the previous one, especially if the initial plot is
time-consuming to create.
 tm_12.ncl: This script shows how to
customize tickmarks by creating your own
using gsn_text_ndc. In this script,
the customized tickmarks are drawn with a background fill color of
yellow, which you cannot do with regular tickmark labels.
tm_12.ncl: This script shows how to
customize tickmarks by creating your own
using gsn_text_ndc. In this script,
the customized tickmarks are drawn with a background fill color of
yellow, which you cannot do with regular tickmark labels.