time vs. latitude Templates
gsn_csm_time_latThe gsn_csm_time_lat plot template expects the input data to be dimensioned (time,lat).
Example pages containing:
tips |
resources |
functions/procedures
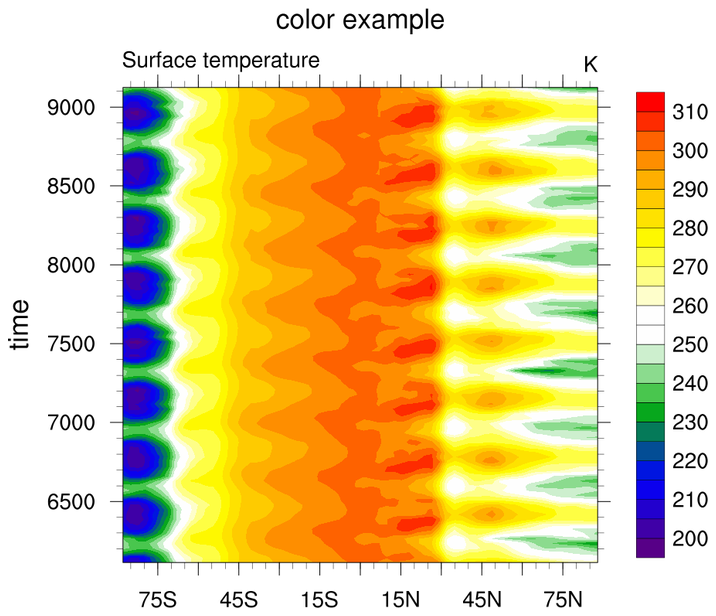
The gsn_csm_time_lat plot template expects the input data to be dimensioned (time,lat).
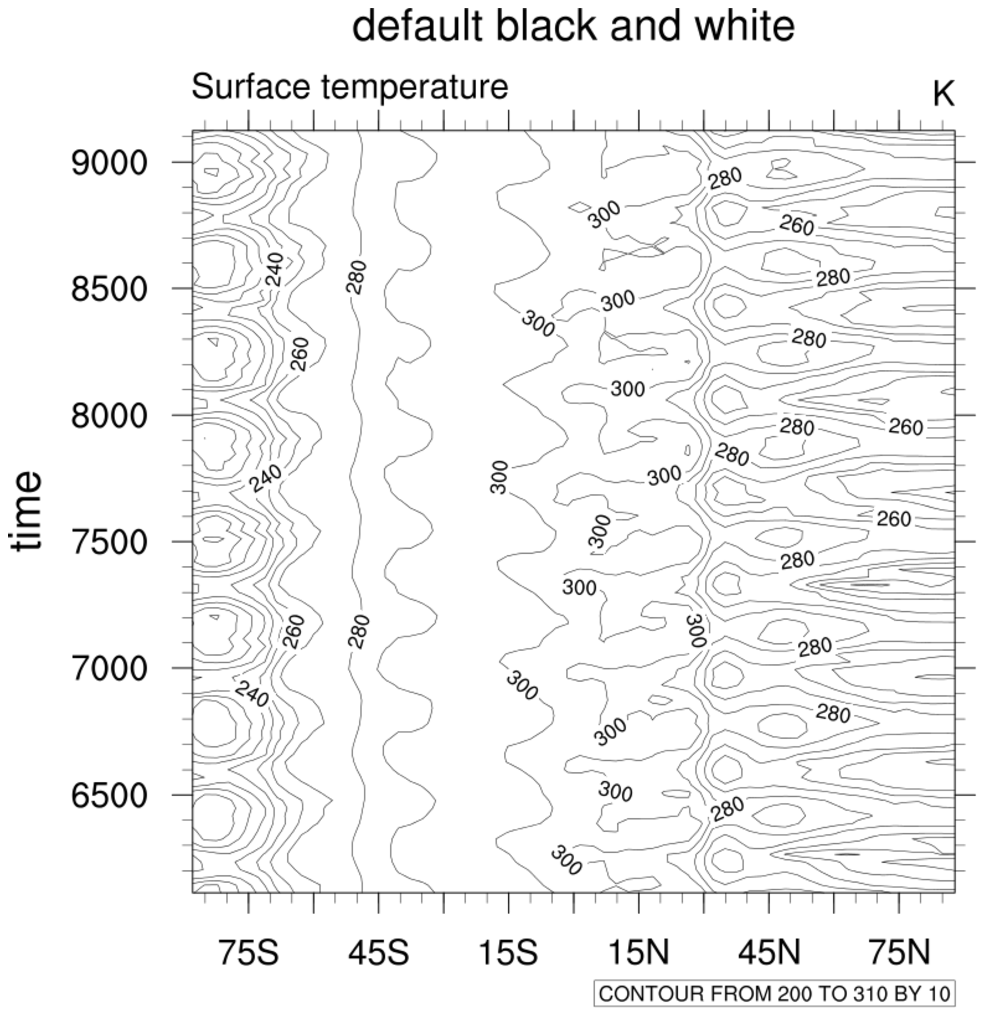 time_lat_1.ncl:
Creates default black and white time vs. latitude plot.
time_lat_1.ncl:
Creates default black and white time vs. latitude plot.