NCL Home>
Application examples>
Non-uniform grids ||
Data files for some examples
Example pages containing:
tips |
resources |
functions/procedures
NCL Graphics: Contour Triangular Meshes

Contouring triangular meshes
The examples below are finite element grids defined by triangular
meshes. For more information on other non-uniform grids that NCL can
handle, see the document
"
Non-uniform
grids that NCL can contour."
If your data is represented by a triangular mesh, that is, if you have
three one-dimensional arrays which represent the X/Y coordinate
points and the data value at each point, then you can use NCL to
contour it.
To contour triangular mesh data:
- You need to either set both the sfYArray
and sfXArray resources to
the lat/lon arrays that define the vertexes of the triangular mesh, or you can set the
arrays using special "lat1d" and "lon1d" attributes. Both methods
are demonstrated in the examples below.
- You need to set the
sfElementNodes resource to the
node array that indicates how the triangles are connected.
- If the node counts starts at index 1 and not 0, then
the sfFirstNodeIndex resource must
be set to 1.
To draw the locations of the lat/lon vertces, or to draw the
triangular mesh structure of the data, you can use
gsn_coordinates, which was updated
in
NCL V6.6.0 to work with mesh data.
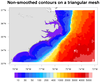
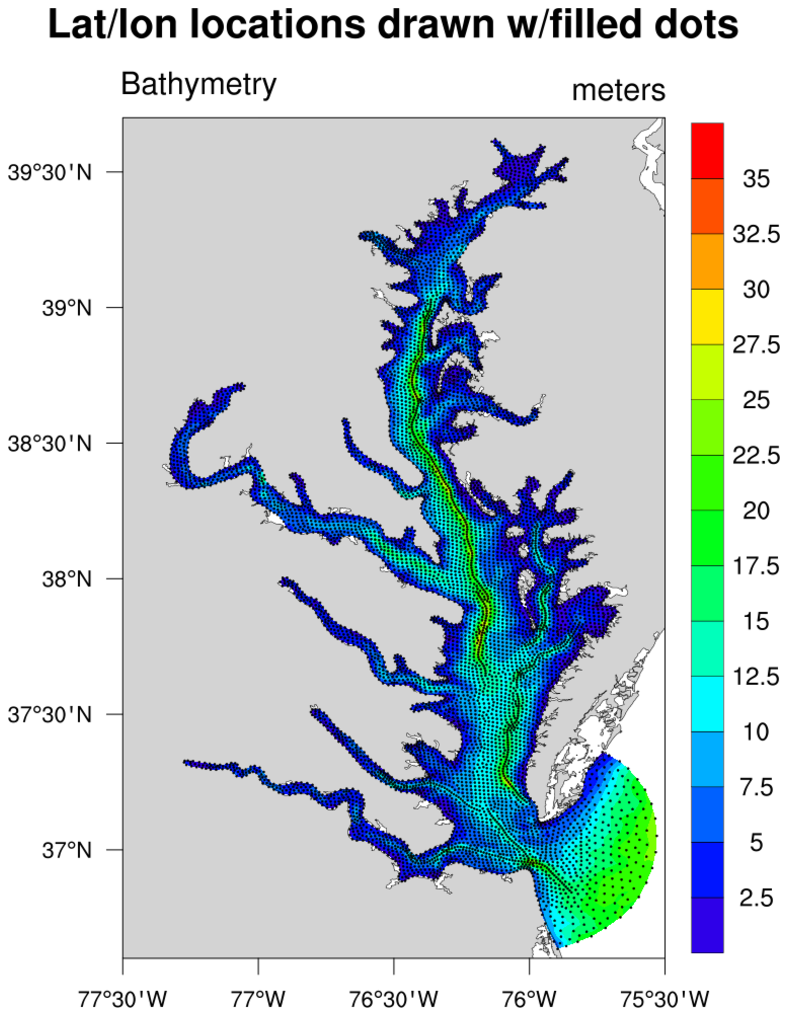
 trimesh_1.ncl
:
This example uses the "lat1d" / "lon1d" attribute method
to define the lat / lon vertexes that make up the triangular mesh.
Note if you print the minimum of the 'ele' array, it is equal to 1. Thus,
sfFirstNodeIndex is set to 1.
 trimesh_2.ncl
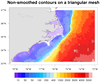
:
This example is similar to the previous example, except it uses
a different dataset, and it uses the
sfYArray
and
sfXArray resources to define
the lat/lon arrays for the triangular mesh.
As with the previous
example, sfFirstNodeIndex is set
to 1 because the node count starts at 1 and not 0.
 trimesh_3.ncl
:
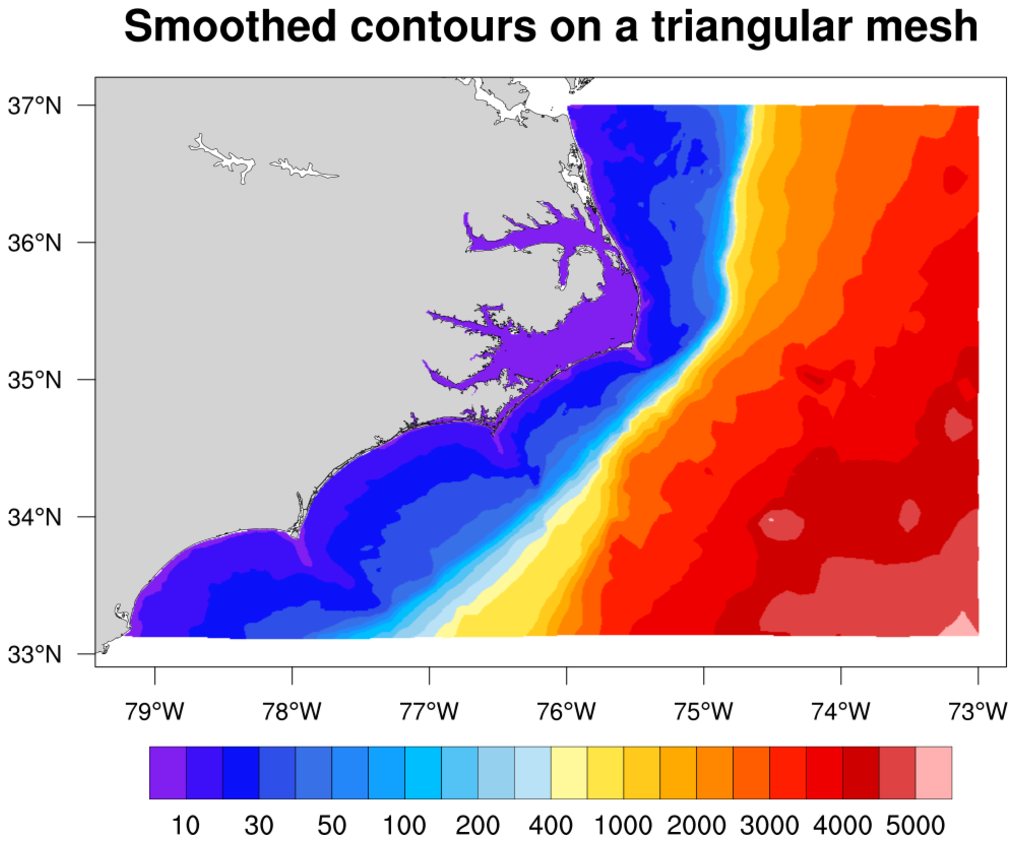
This example, which uses the same data as trimesh_1.ncl, shows how to
draw filled dots showing the lat/lon locations of triangular mesh data
using
gsn_coordinates.
The gsn_coordinates will recognize
the special "lat1d" and "lon1d" attributes attached to the "depth" variable,
so all you need for plotting the markers is to specify size, color, marker type,
if desired.
You need NCL version 6.4.0 or
later to run this example.
 trimesh_4.ncl
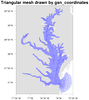
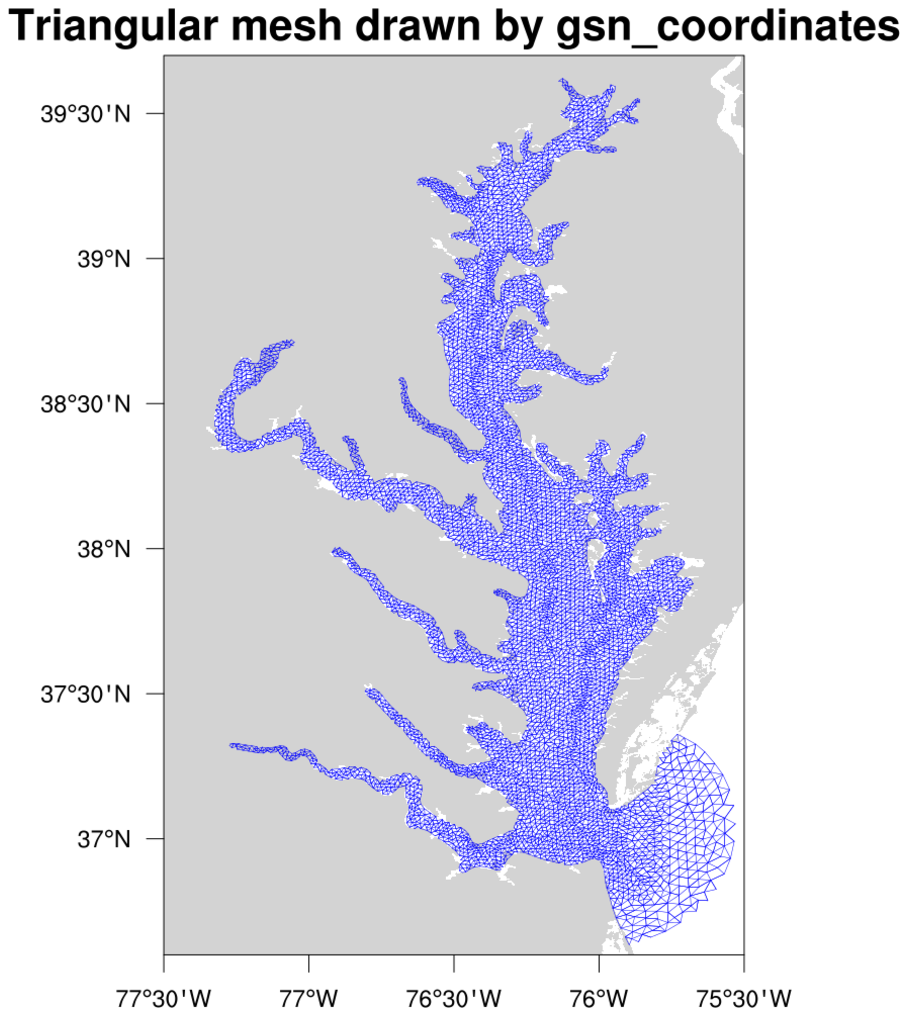
:
This example shows how to draw the triangular mesh from
example trimesh_1.ncl over a map plot.
The
gsn_coordinates procedure
is used to draw the mesh, by setting these resources:
  lnres@gsnCoordsMeshVerticesOnCell     = f->ele
  lnres@gsnCoordsMeshLatVertices        = f->lat
  lnres@gsnCoordsMeshLonVertices        = f->lon
  lnres@gsnCoordsMeshVerticesStartIndex = 1
You need
NCL version 6.6.0 or
later to run this example.
 trimesh_5.ncl
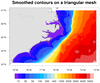
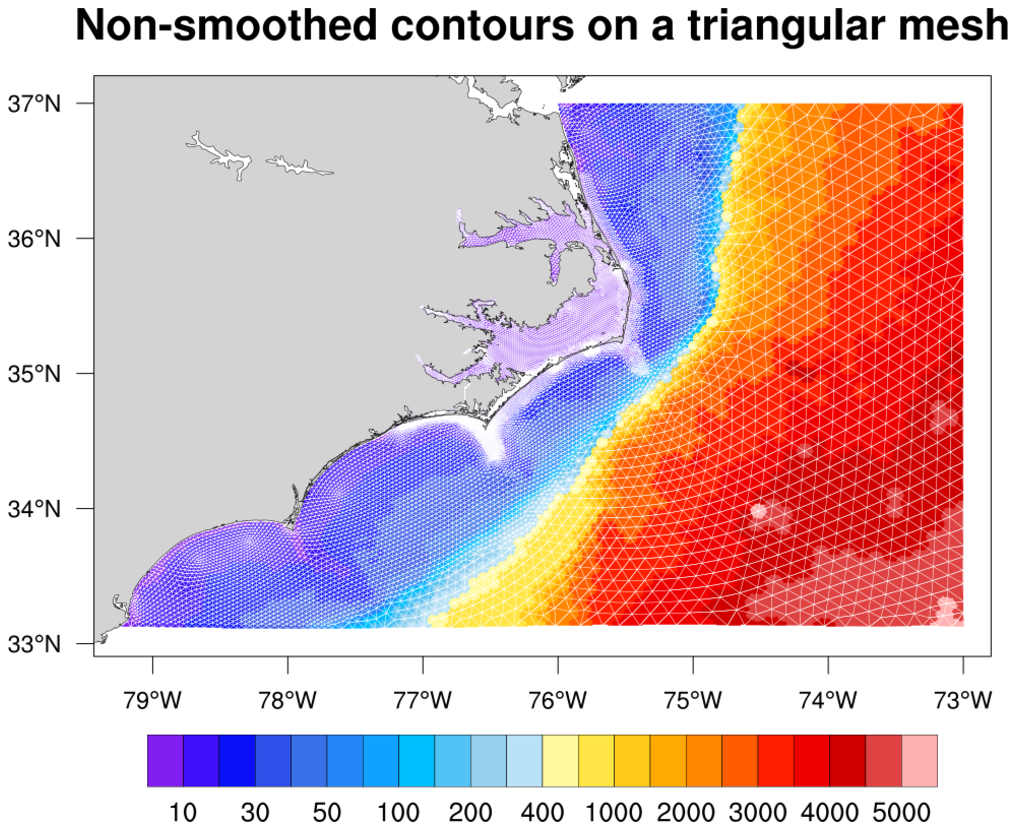
:
This example, which uses the same data as trimesh_2.ncl, shows how to
draw the triangular mesh on top of the contoured data using
gsn_coordinates.
The filled contours are made partially opaque by setting
the cnFillOpacityF
resource.
You need NCL version 6.6.0 or
later to run this example.

