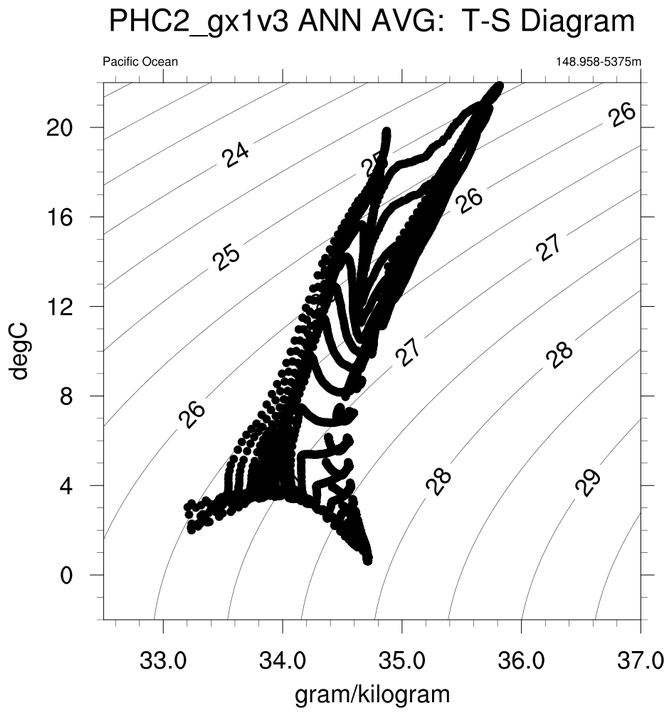
A T-S diagram is a graph showing the relationship between temperature
and salinity as observed together at, for example, specified depths in
a water column. Isopleths of constant density are often also drawn on
the same diagram as a useful additional interpretation aid. In the
ocean certain T-S combinations are preferred which leads to the
procedure of identification via the definition of water types and
water masses and their distributions.
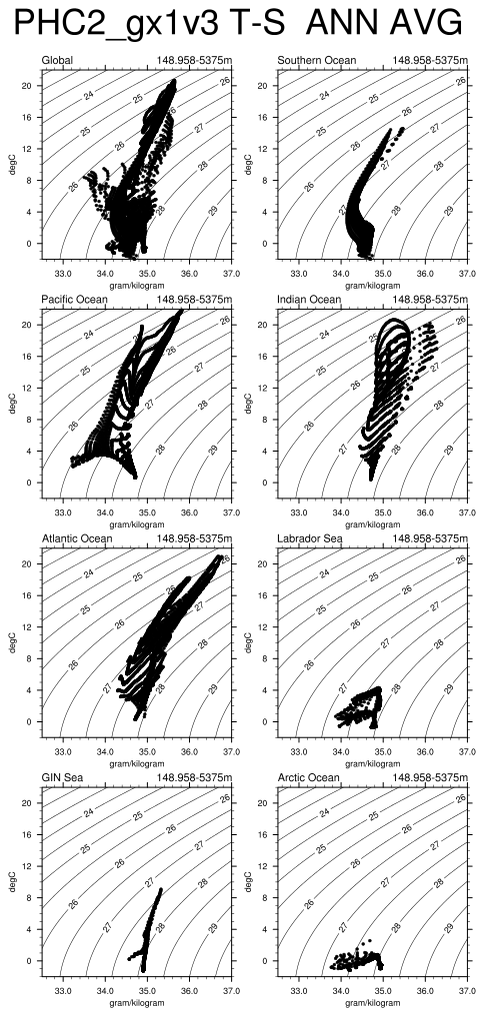
These example scripts create T-S diagrams based on global or
CESM/POP-defined ocean basins employing a scattergram format with
temperature on the ordinate (Y axis) and salinity on the abscissa (X
axis).
Christine Shields, an associate scientist at NCAR, provided these
example scripts.