The WRF "2D" model output uses cartesian coordinates (MAP_PROJ=0). Geographic related variables and information (eg, XLAT, XLONG, CEN_LAT, etc) are zero-filled and can be ignored. The distance between grid points and the time-step are available from the global attributes DX, DY and DT, respectively.
NCL Home>
Application examples>
Models ||
Data files for some examples
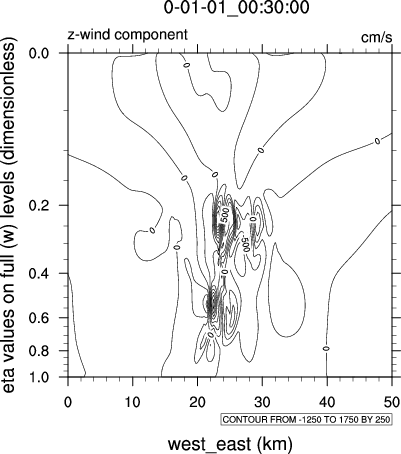
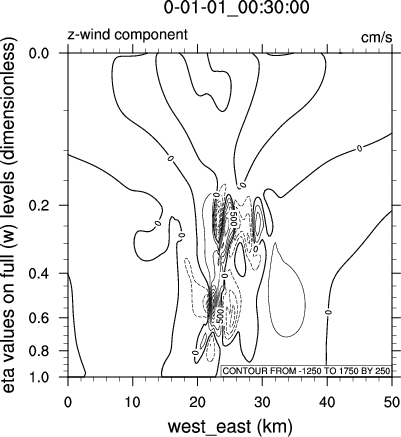
 WRF_2d_1.ncl: Simple black and white
vertical cross sections. The second plot draws the negative values as
dashed lines and move the location of the contour info label box.
WRF_2d_1.ncl: Simple black and white
vertical cross sections. The second plot draws the negative values as
dashed lines and move the location of the contour info label box.
 WRF_2d_2.ncl: The color plot uses
symMinMaxPlt
to determine 'nice' min/max contour levels so blue and red represent down and up
motions.
WRF_2d_2.ncl: The color plot uses
symMinMaxPlt
to determine 'nice' min/max contour levels so blue and red represent down and up
motions.
Example pages containing:
tips |
resources |
functions/procedures
NCL Graphics: WRF (2D data)
This page is rather out-of-date. We recommend that you visit the
more up-to-date WRF-ARW
Online Tutorial for examples of using NCL to plot WRF-ARW
data.

 WRF_2d_1.ncl: Simple black and white
vertical cross sections. The second plot draws the negative values as
dashed lines and move the location of the contour info label box.
WRF_2d_1.ncl: Simple black and white
vertical cross sections. The second plot draws the negative values as
dashed lines and move the location of the contour info label box.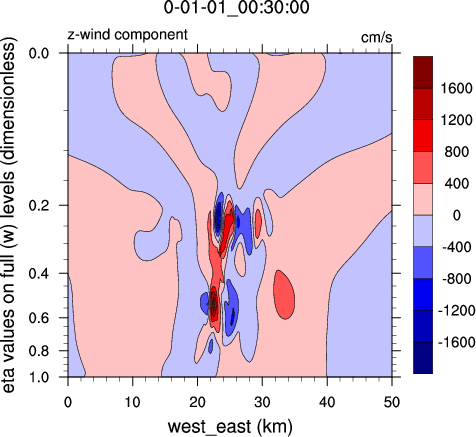 WRF_2d_2.ncl: The color plot uses
symMinMaxPlt
to determine 'nice' min/max contour levels so blue and red represent down and up
motions.
WRF_2d_2.ncl: The color plot uses
symMinMaxPlt
to determine 'nice' min/max contour levels so blue and red represent down and up
motions.

