Some variables are read directly from the WRF output file, while others are read via wrf_user_getvar.
For more meaningful plots of WRF data, see the WRF-ARW Online Tutorial.
Example pages containing:
tips |
resources |
functions/procedures
Some variables are read directly from the WRF output file, while others are read via wrf_user_getvar.
For more meaningful plots of WRF data, see the WRF-ARW Online Tutorial.
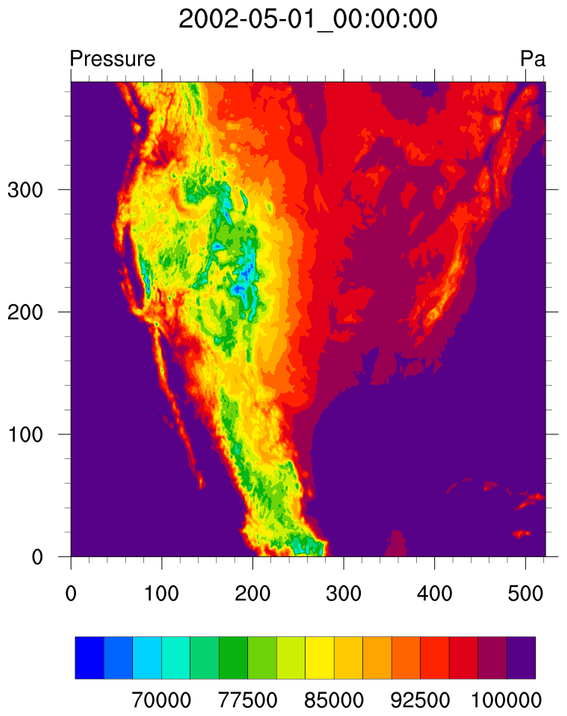
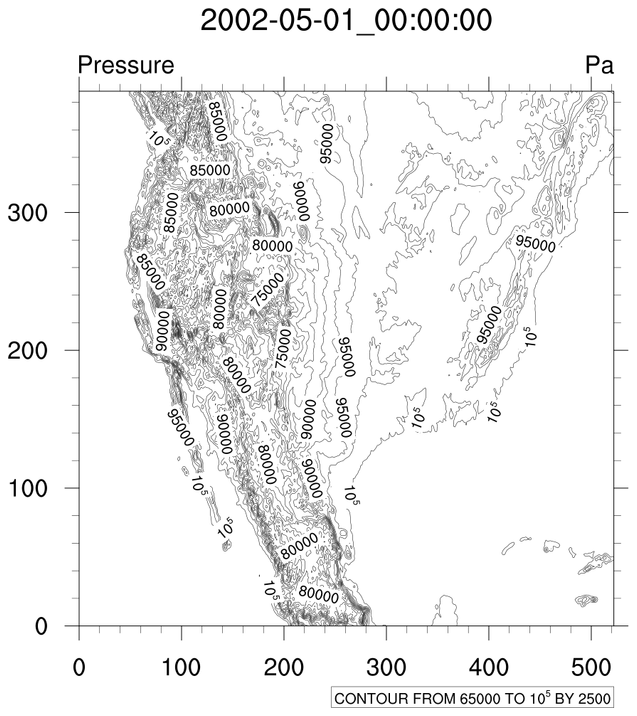 WRF_cn_1.ncl: A simple contour
plot of the pressure field at a specific time and level.
WRF_cn_1.ncl: A simple contour
plot of the pressure field at a specific time and level.
The default contour plot is a black-and-white line contour plot. Setting cnFillOn to True turns on color fill.
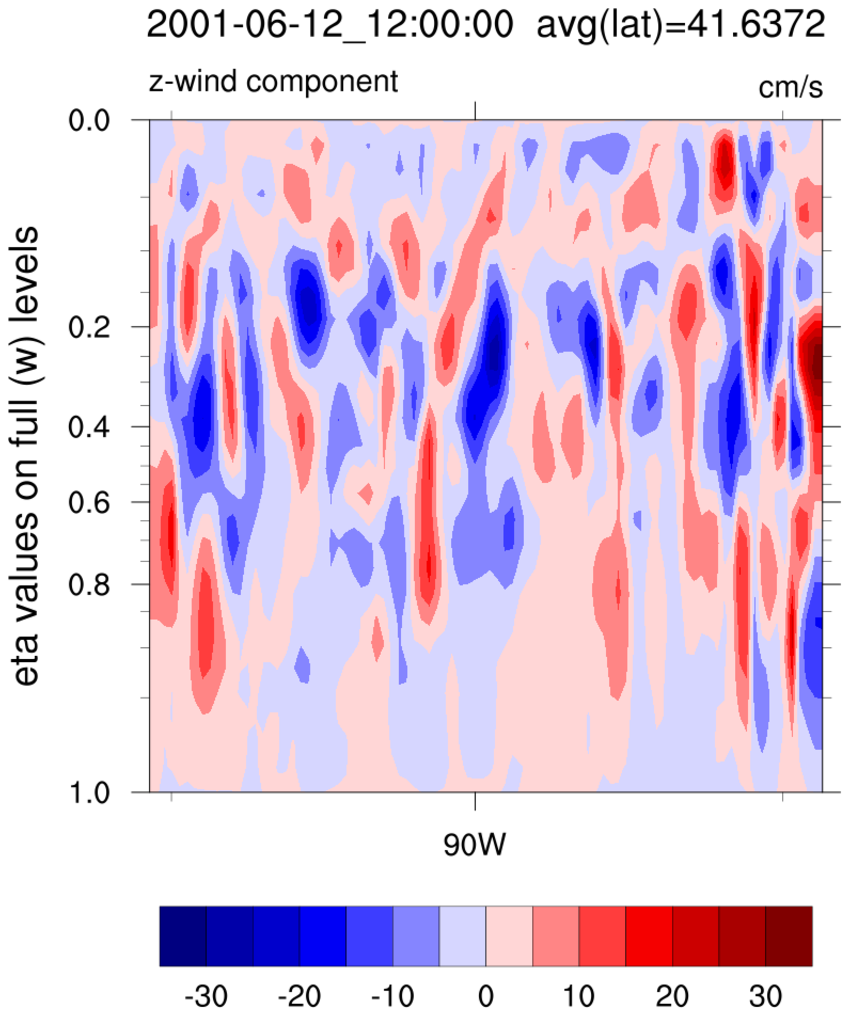 WRF_cn_2.ncl: This creates an
eta-longitude cross-section at a specific time and latitude.
WRF_cn_2.ncl: This creates an
eta-longitude cross-section at a specific time and latitude.
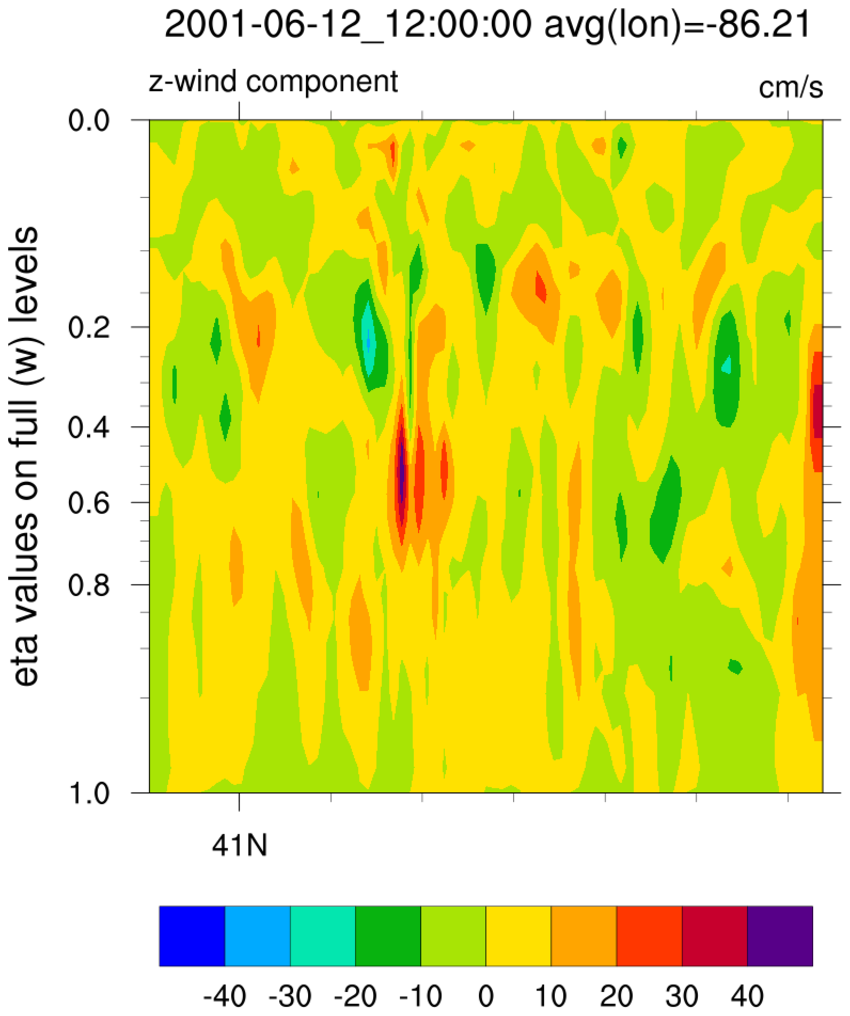 WRF_cn_3.ncl: Creates an eta-latitude
cross-section at a specific time and longitude.
WRF_cn_3.ncl: Creates an eta-latitude
cross-section at a specific time and longitude.
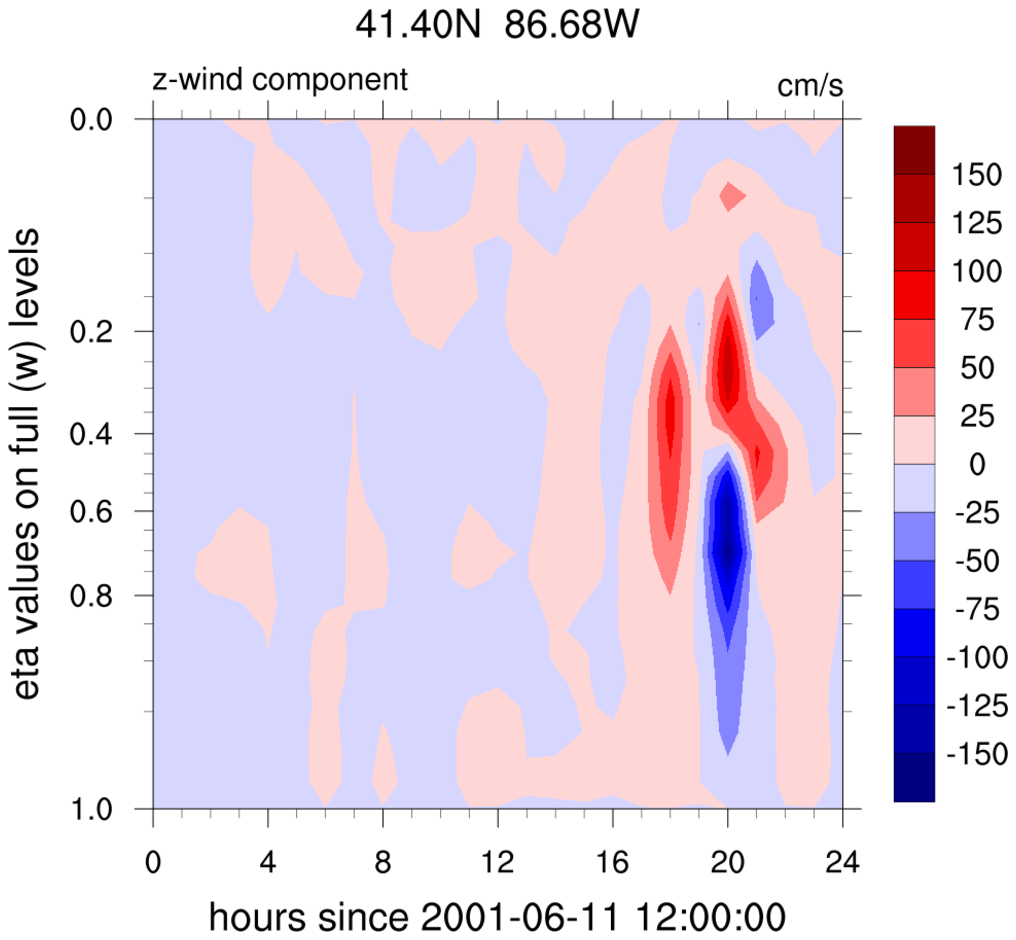 WRF_cn_4.ncl: An eta-time contour plot
that requires dimension reordering to reshape the data.
WRF_cn_4.ncl: An eta-time contour plot
that requires dimension reordering to reshape the data.