NCL Home>
Application examples>
Models ||
Data files for some examples
 wrf_interp_1.ncl: This script
interpolates t2 along a horizontal line from five WRF output files,
and plots the data against longitude using an XY plot.
wrf_interp_1.ncl: This script
interpolates t2 along a horizontal line from five WRF output files,
and plots the data against longitude using an XY plot.
 wrf_interp_2.ncl: This script
uses wrf_user_interp_level to
extract a horizontal slice from several 3D WRF fields at the 500 mb level.
wrf_interp_2.ncl: This script
uses wrf_user_interp_level to
extract a horizontal slice from several 3D WRF fields at the 500 mb level.
 wrf_interp_3.ncl:
This script uses wrf_user_vert_cross to
interpolate a vertical cross-section from several 3D WRF-ARW fields. line
for the cross section is creating using start and end lat/lon points.
wrf_interp_3.ncl:
This script uses wrf_user_vert_cross to
interpolate a vertical cross-section from several 3D WRF-ARW fields. line
for the cross section is creating using start and end lat/lon points.

 wrf_interp_4.ncl:
This script
uses wrf_user_interp_level to
extract a horizontal slice from several 3D WRF fields at four
different pressure levels.
wrf_interp_4.ncl:
This script
uses wrf_user_interp_level to
extract a horizontal slice from several 3D WRF fields at four
different pressure levels.
 wrf_interp_5.ncl: Similar to
wrf_interp1.ncl above, this script
uses wrf_user_interp_line to
interpolate t2 along a line from five WRF output files, and plots the
data using an XY plot.
wrf_interp_5.ncl: Similar to
wrf_interp1.ncl above, this script
uses wrf_user_interp_line to
interpolate t2 along a line from five WRF output files, and plots the
data using an XY plot.
Example pages containing:
tips |
resources |
functions/procedures
NCL Graphics: WRF Interpolations and Cross Sections
This page provides examples of three interpolation and cross-section
routines added in NCL Version 6.6.0 for WRF-ARW data, which are meant
as replacements for
the wrf_user_intrp2d and
wrf_user_intrp3d functions:
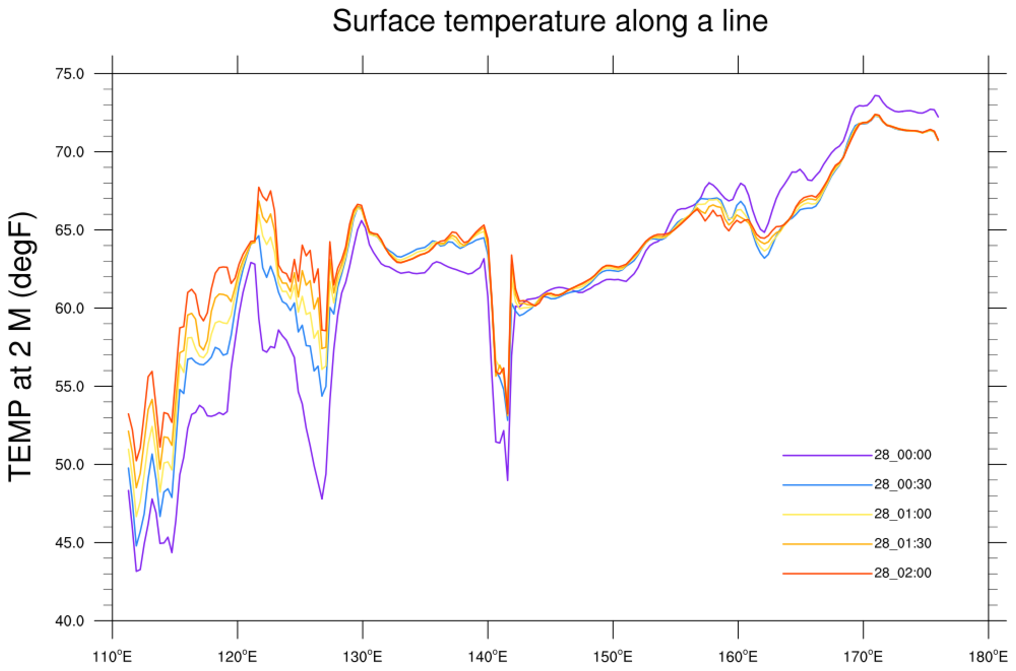 wrf_interp_1.ncl: This script
interpolates t2 along a horizontal line from five WRF output files,
and plots the data against longitude using an XY plot.
wrf_interp_1.ncl: This script
interpolates t2 along a horizontal line from five WRF output files,
and plots the data against longitude using an XY plot.
wrf_user_interp_line is used to the interpolation across a horizontal line, using an angle of 90 and a pivot point in the lat/lon plane. The result is an array that has been interpolated at a particular latitude value, for a series of longitude values.
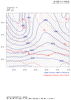
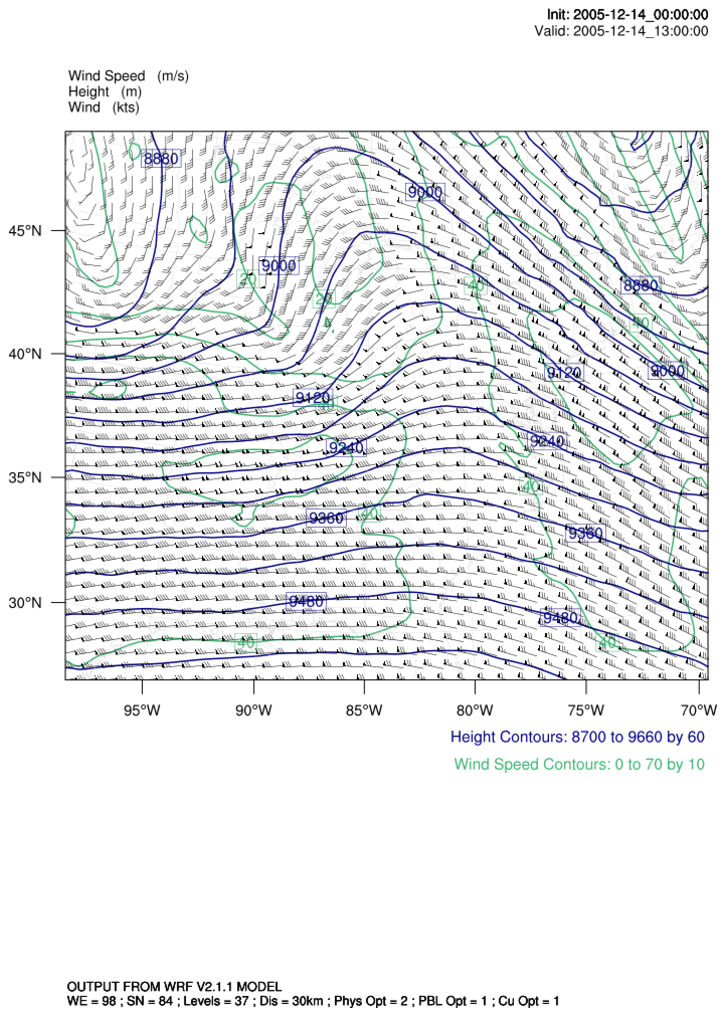
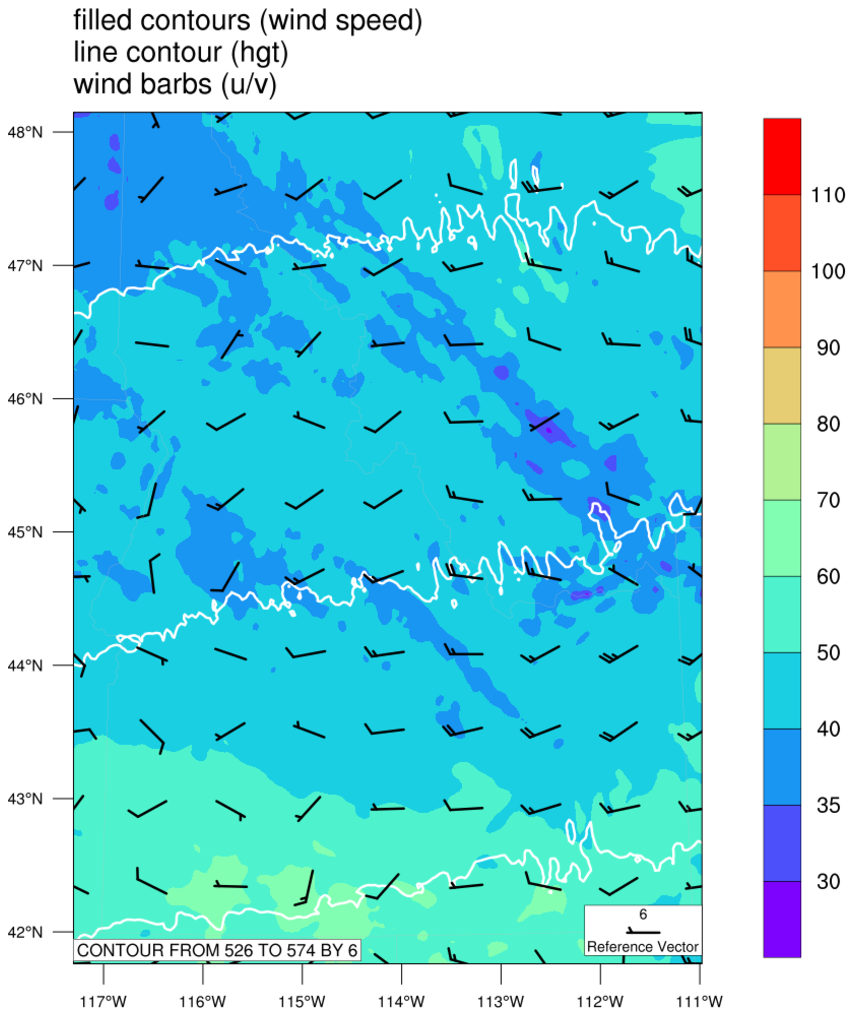 wrf_interp_2.ncl: This script
uses wrf_user_interp_level to
extract a horizontal slice from several 3D WRF fields at the 500 mb level.
wrf_interp_2.ncl: This script
uses wrf_user_interp_level to
extract a horizontal slice from several 3D WRF fields at the 500 mb level.
Three plots are created and overlaid on a single map plot:
- contour line plot of height
- filled contour plot of wind speed
- wind bars (vector) plot of U and V
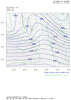
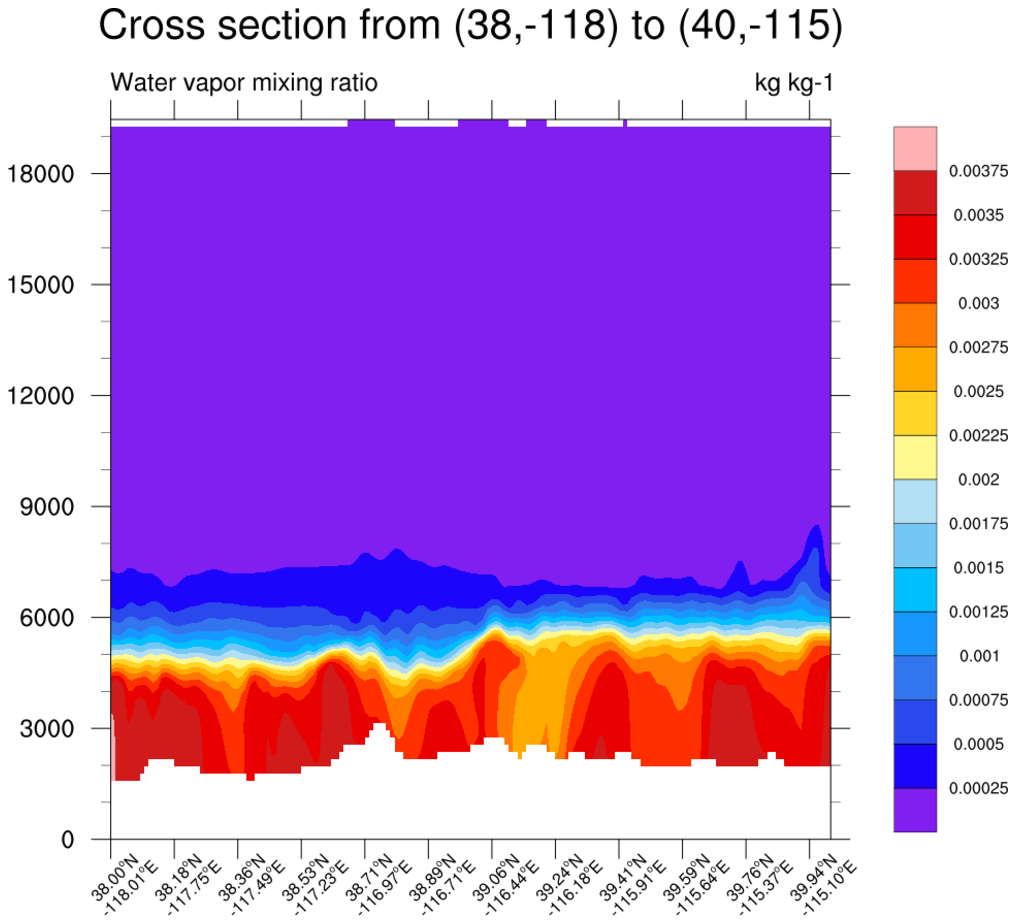 wrf_interp_3.ncl:
This script uses wrf_user_vert_cross to
interpolate a vertical cross-section from several 3D WRF-ARW fields. line
for the cross section is creating using start and end lat/lon points.
wrf_interp_3.ncl:
This script uses wrf_user_vert_cross to
interpolate a vertical cross-section from several 3D WRF-ARW fields. line
for the cross section is creating using start and end lat/lon points.
By setting the special linecoords attribute to True, the lat/lon values representing the cross section are returned, and used to label the X axis.
A Python version of this projection is available here.
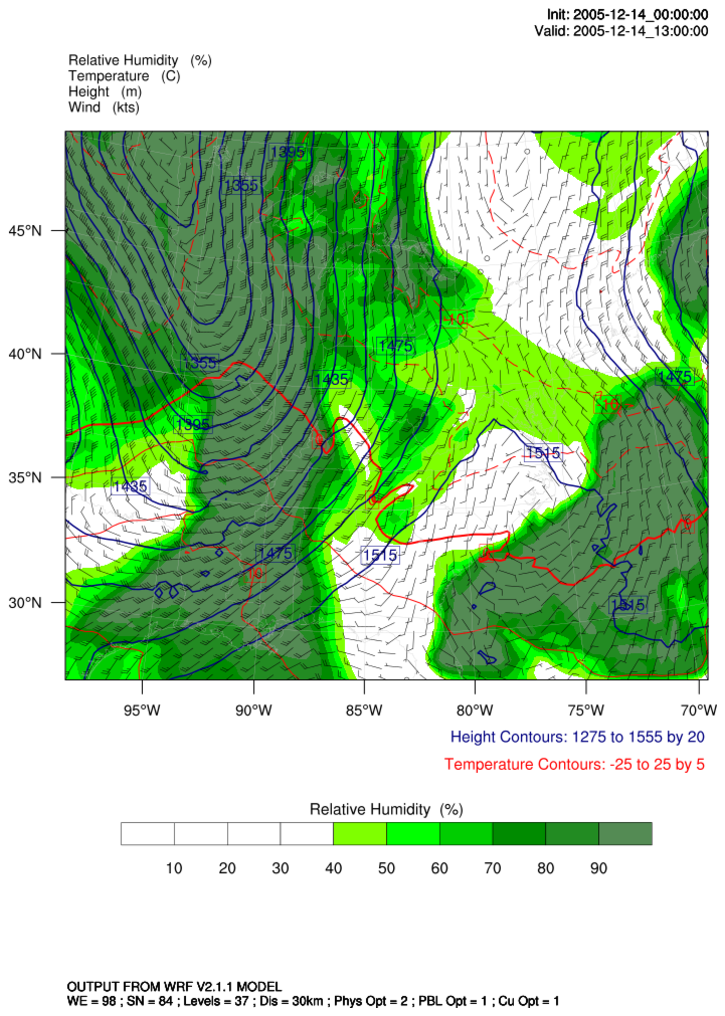
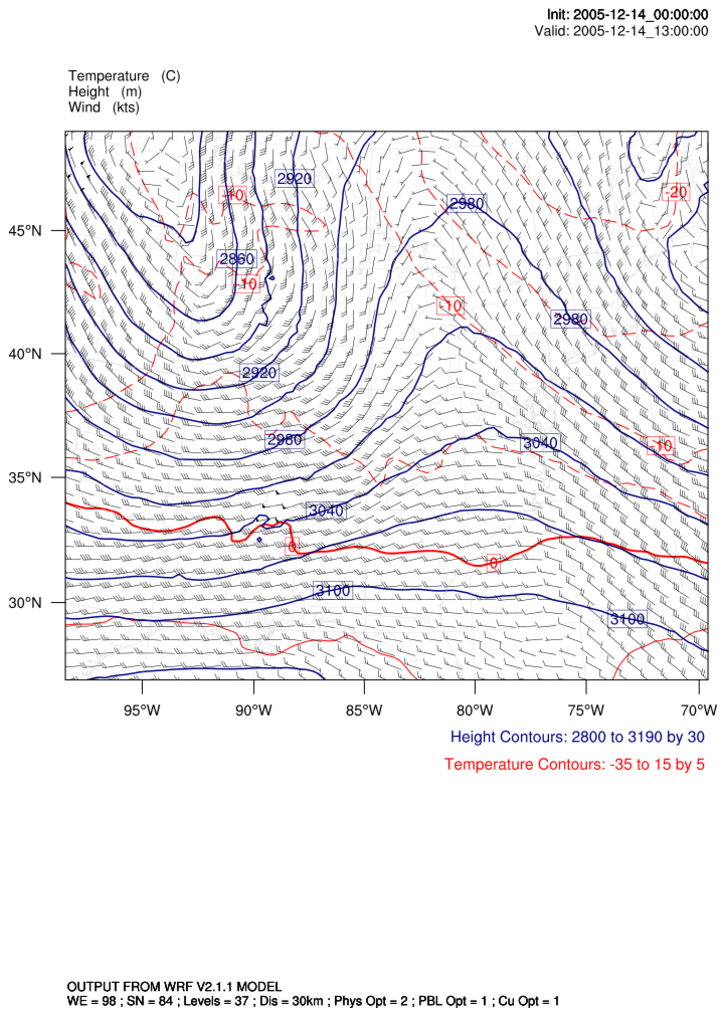
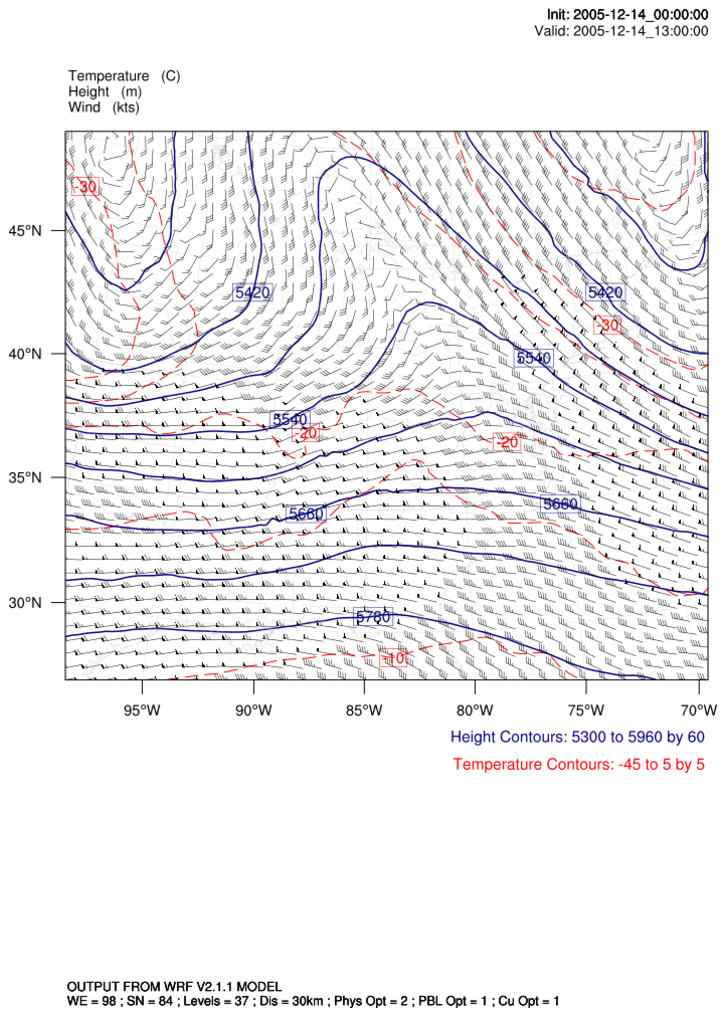
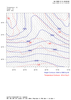
 wrf_interp_4.ncl:
This script
uses wrf_user_interp_level to
extract a horizontal slice from several 3D WRF fields at four
different pressure levels.
wrf_interp_4.ncl:
This script
uses wrf_user_interp_level to
extract a horizontal slice from several 3D WRF fields at four
different pressure levels.
A different type of plot is created for each level, using wrf_contour, wrf_vector, and wrf_map_overlays. This results in some nice titles above each plot and an informational label below each plot.
This script was written to handle WRF files that may have multiple timesteps. This particular file only had one time step.
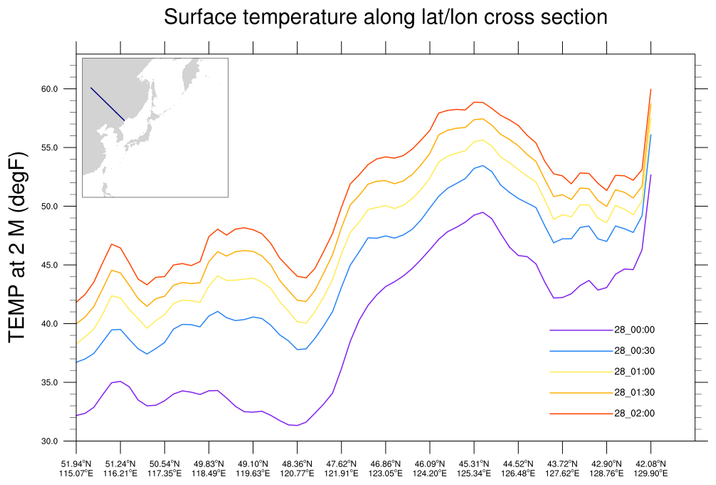
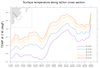
wrf_interp_5.ncl: Similar to
wrf_interp1.ncl above, this script
uses wrf_user_interp_line to
interpolate t2 along a line from five WRF output files, and plots the
data using an XY plot.
This time, however, start and end lat/lon points are used to define the line for the interpolation in the lat/lon plane, resulting in an interpolation across a series of lat, lon pairs.
The XY plot displays the lat, lon pairs on the X axis. As an added bonus, a map plot is added as an annotation of the XY plot, showing the lat/lon cross-section line.