NCL Home>
Application examples>
Models ||
Data files for some examples
Example pages containing:
tips |
resources |
functions/procedures
Using NCL with VAPOR to analyze WRF-ARW data in 3D

As a result of a collaboration between the NCL and VAPOR teams at
NCAR, users can now display NCL plots of WRF output in 3D, combined
with satellite images, political boundaries and other images from Web
mapping services. There's a
short
tutorial to help users use this feature.
This page illustrates three different ncl scripts (these are originally from the WRF NCL graphics example page. Each of these scripts is modified to produce one image per timestep, and then the script is modified to output a georeferenced tiff image. The georeferenced tiff image can then be inserted in a 3D VAPOR scene at the appropriate coordinates. Additional data can be visualized in the same scene.
The three scripts illustrate (1) use of a horizontal cross-section plot (based on wrf_Height.ncl) at a particular height,
(2) use of a horizontal plot (based on wrf_Precip.ncl) that is appropriately placed at any height or mapped to the terrain, and
(3) use of a vertical cross sectional plot (based on wrf_CrossSection2.ncl).
The data used for these images and scripts can be downloaded as a
zip file
or a
gzipped tar file.
For downloads and documentation on VAPOR, check the
VAPOR home page.
More information about georeferenced images in VAPOR can be found in the
VAPOR/WRF Data and Image Preparation Guide.
We would like to hear your feedback: Is this feature useful? Is it
easy enough to use? Is the documentation OK? Please send your
comments to ncl-talk.
 [wrf_Height.ncl]
:
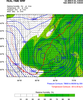
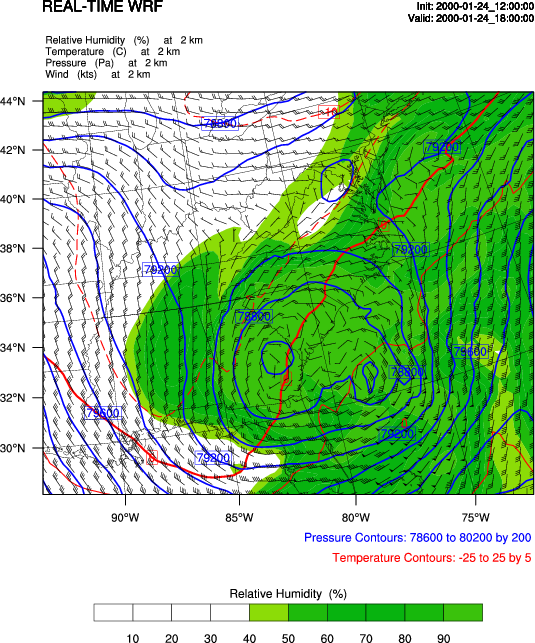
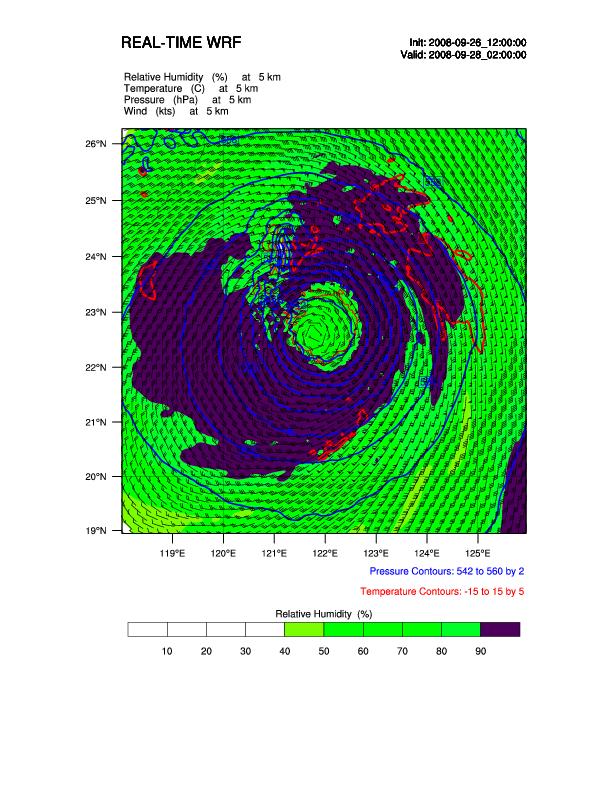
Original wrf_Height script from WRF-NCL website. This script calculates relative humidity, pressure, temperature, and wind barbs at two different heights, 250m and 2000m.
 [wrf_Height_FirstMod.ncl]
:
This is a modification of the above script. It now uses the Jangmi typhoon dataand it produces only one image per time step.
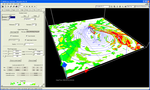
The displayed plot is a horizontal cross-section at 5km.
 [wrf_Height_Final.ncl]
:
Additional changes to the wrf_Height script were made to produce georeferenced tiff images as output. The changes are described in
the VAPOR-WRF-NCL tutorial.
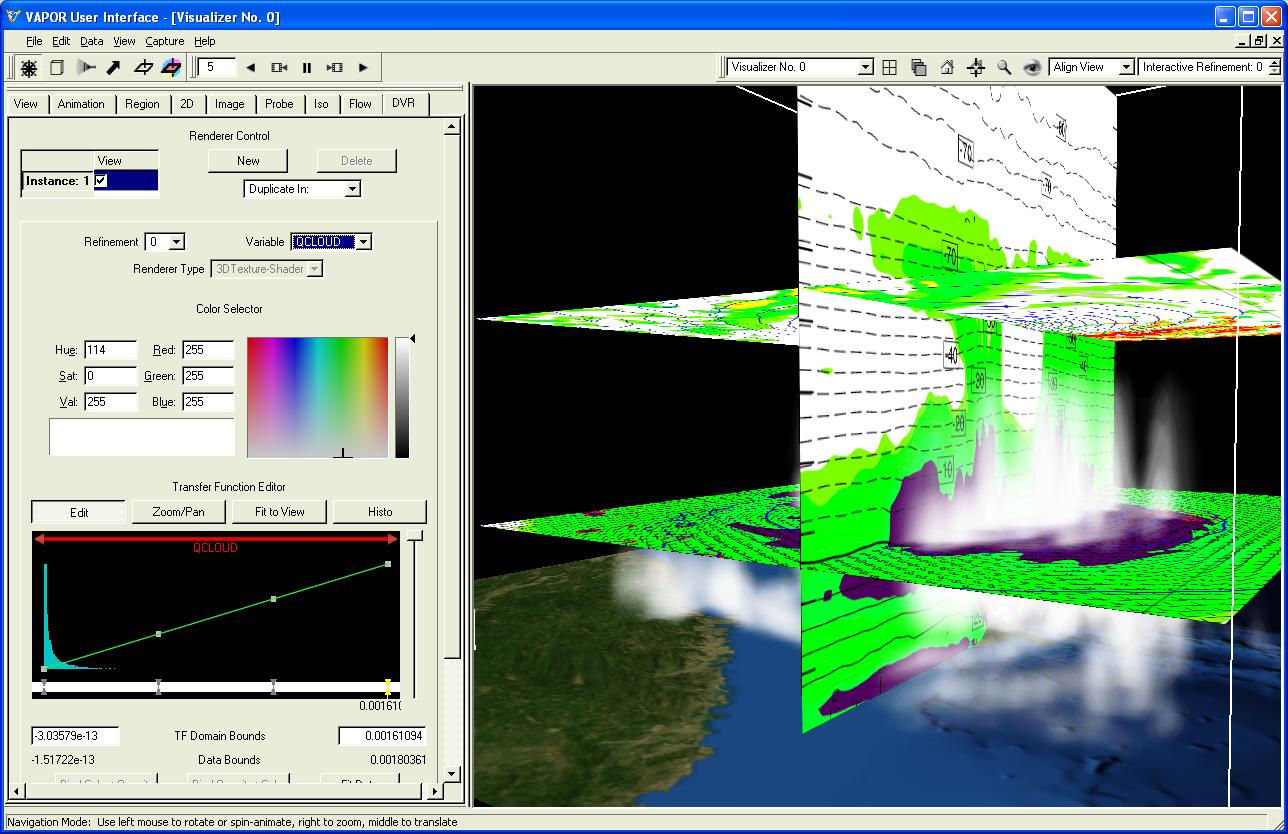
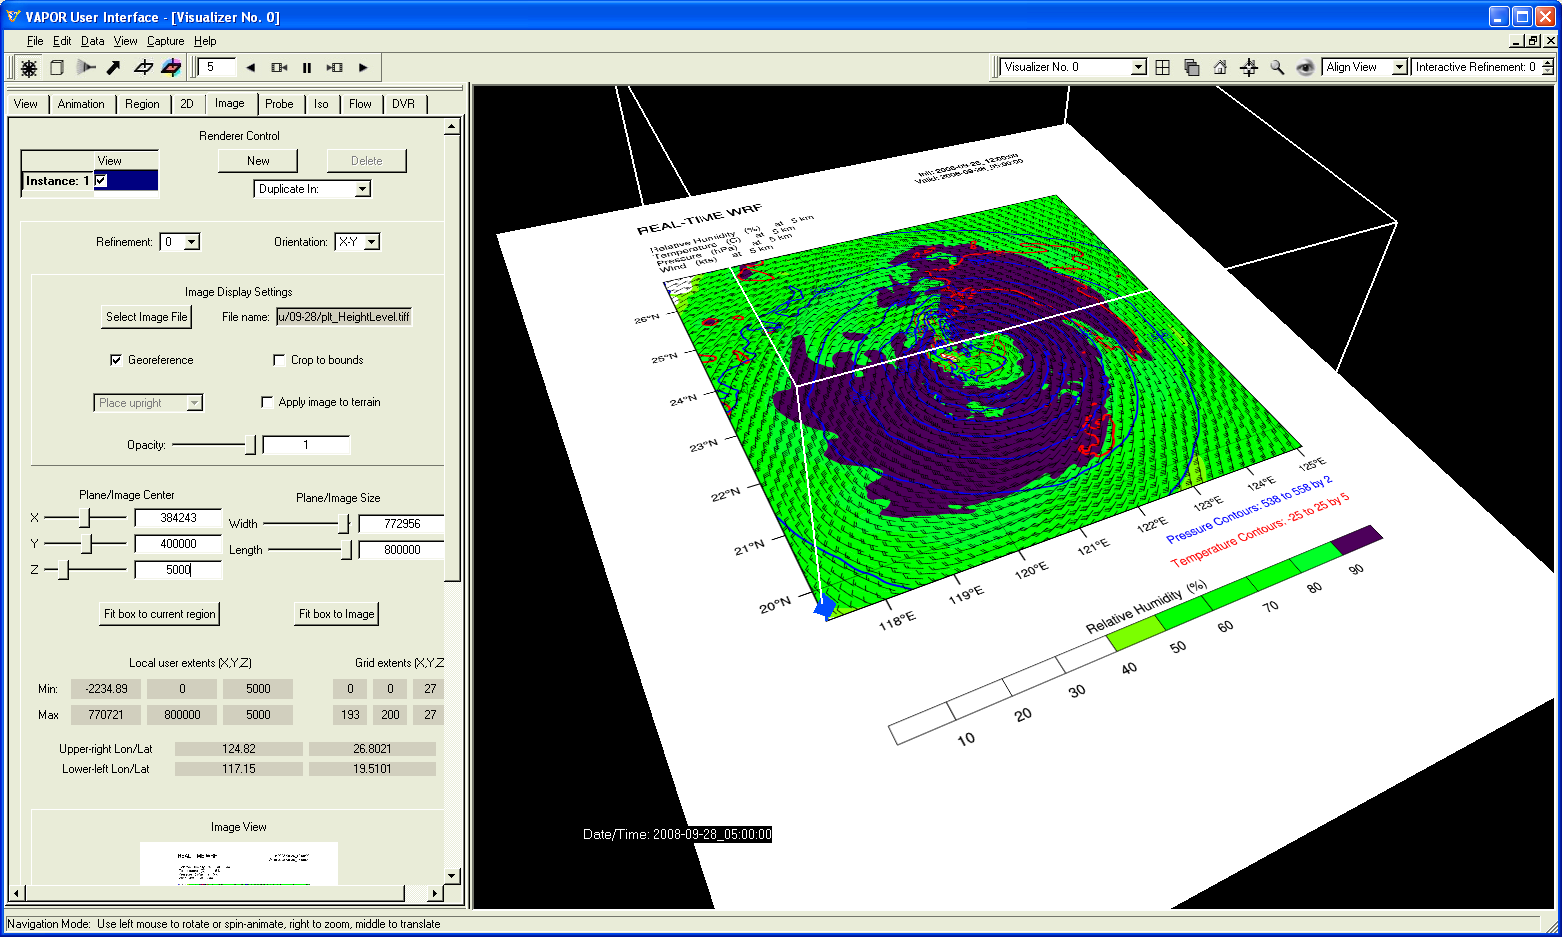
The wrf_Height script is modified to produce tiff images.
Then these images are inserted into a VAPOR 3D visualization.
The georeferencing in the image is used to position the plot at the correct world coordinates.
The height of the plot (5000m) is set so that VAPOR positions the plot at the correct height in the scene.
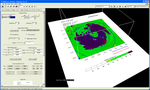
 [height.vss]
:
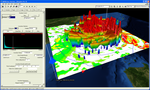
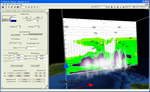
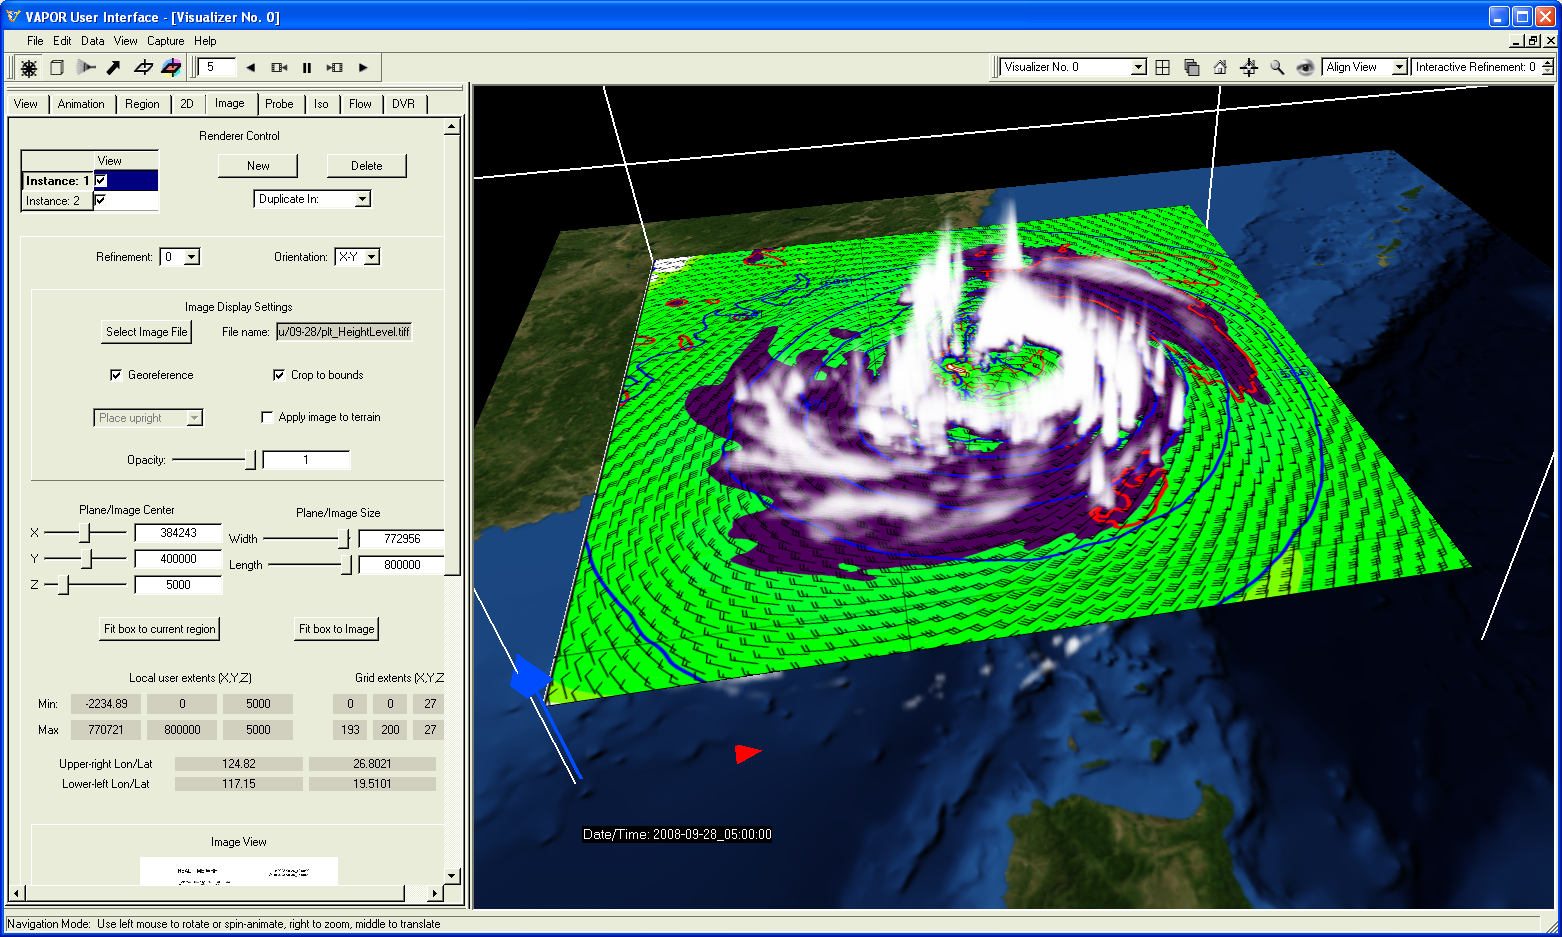
Additional images, both 2D and 3D, can be combined in the VAPOR scene to provide a context for the NCL plot.
The VAPOR session file "height.vss" can be read by VAPOR to set up the visualization shown in this image. The WRF QCLOUD variable is volume rendered, providing an indication of the extent of the typhoon.
The larger geographic context is shown by including a terrain image (obtained using the VAPOR application getWMSImage.sh).
Note that the 3D visualization requires the typhoon Jangmi in VAPOR format.
The typhoon data is available in vapor format for download from
the VAPOR example data download page.
 [wrf_Precip.ncl]
:
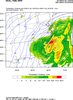
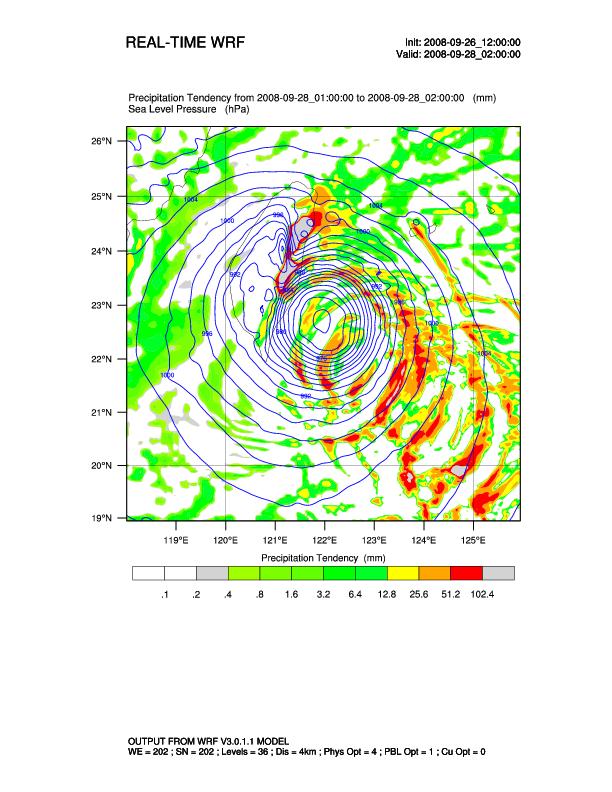
The original wrf_Precip.ncl script plots precipitation tendency as well as isobars of sea-level pressure. There are two other images produced by this script that will not be used here.
 [wrf_Precip_FirstMod.ncl]
:
The wrf_Precip Script is modified to produce one image per timestep.
The script is also modified so that it reads typhoon Jangmi data files.
 [wrf_Precip_Final.ncl]
:
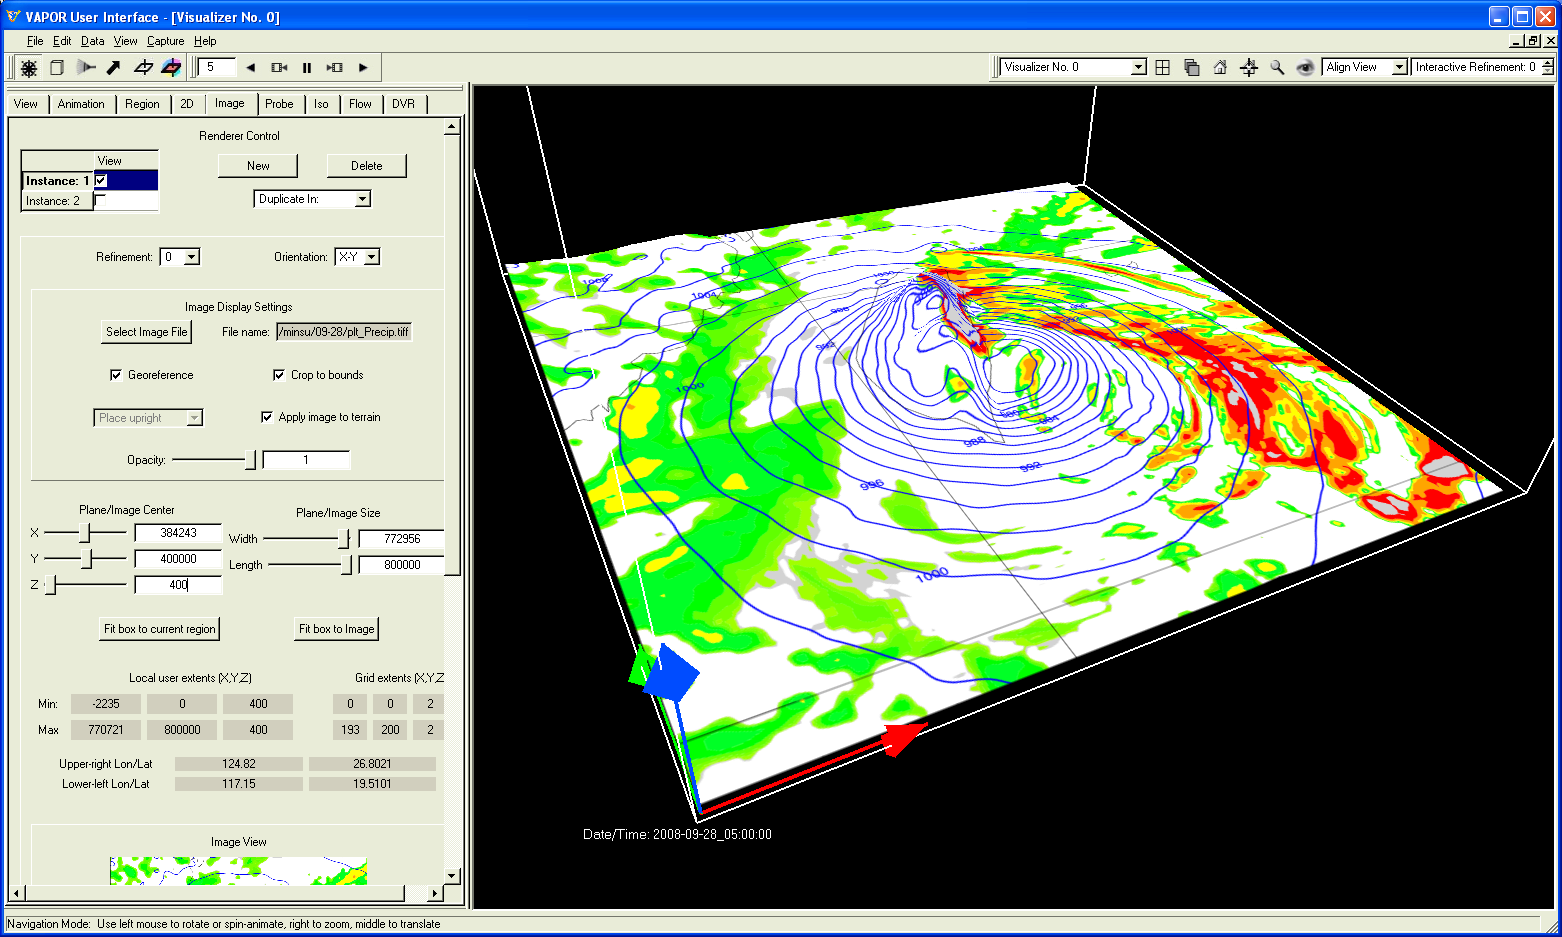
To provide a sequence of images to display in VAPOR, the
wrf_Precip.ncl script was modified to produce a tiff image at each timestep.
These images are then loaded into VAPOR. The images are applied to the terrain; the increased elevation of Taiwan is apparent near the center of the storm.
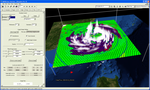
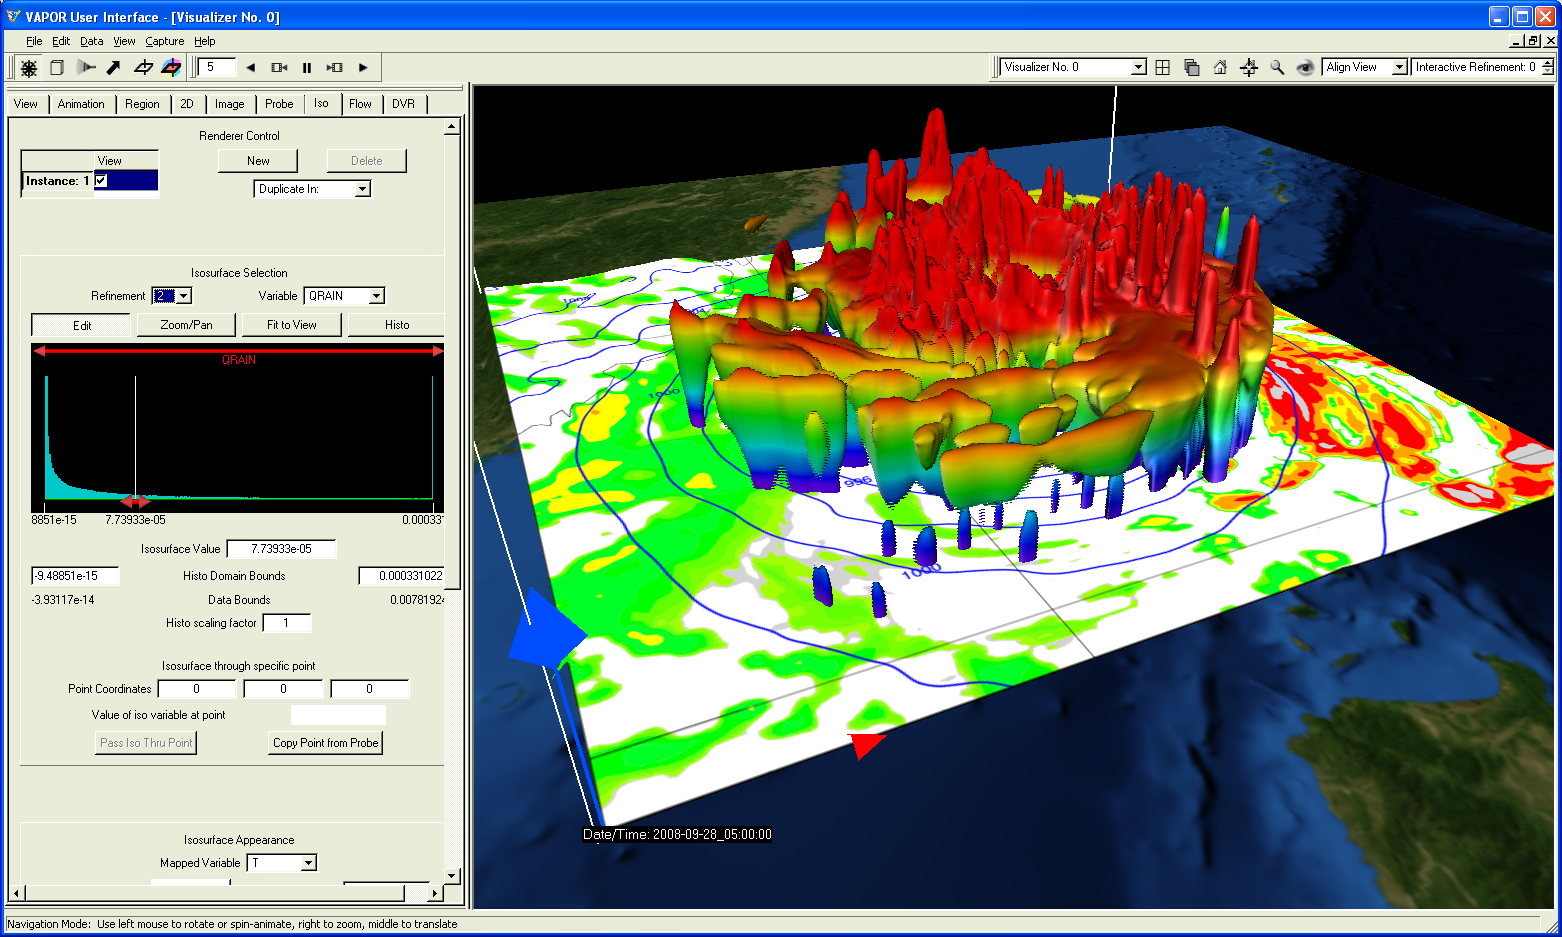
 [precip.vss]
:
The wrf_Precip image is combined with a satellite image of the terrain surface and an isosurface of the QRAIN variable.
The isosurface is colored according to temperature.
The vapor session file (precip.vss) can be read by VAPOR to establish the parameter settings used in this visualization.
Note that the 3D visualization requires the typhoon Jangmi in VAPOR format.
The typhoon data can be converted from the wrf output or it is
is available for download from
the VAPOR download page.
 [wrf_CrossSection2.ncl]
:
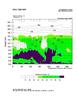
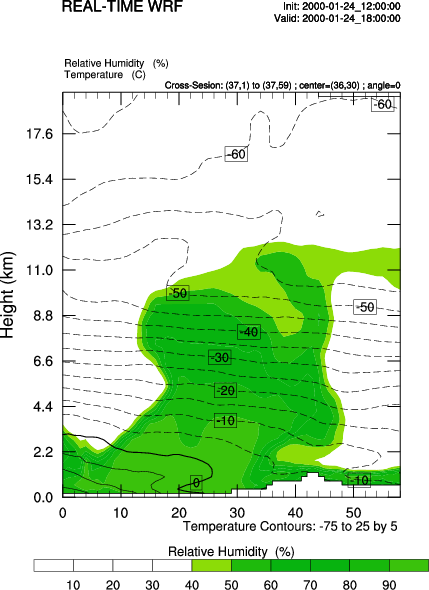
We start with the wrf_CrossSection2.ncl script from WRF-NCL website.
This script results in a vertical cross section plot of temperature and humidity.
 [wrf_CrossSection2_FirstMod.ncl]
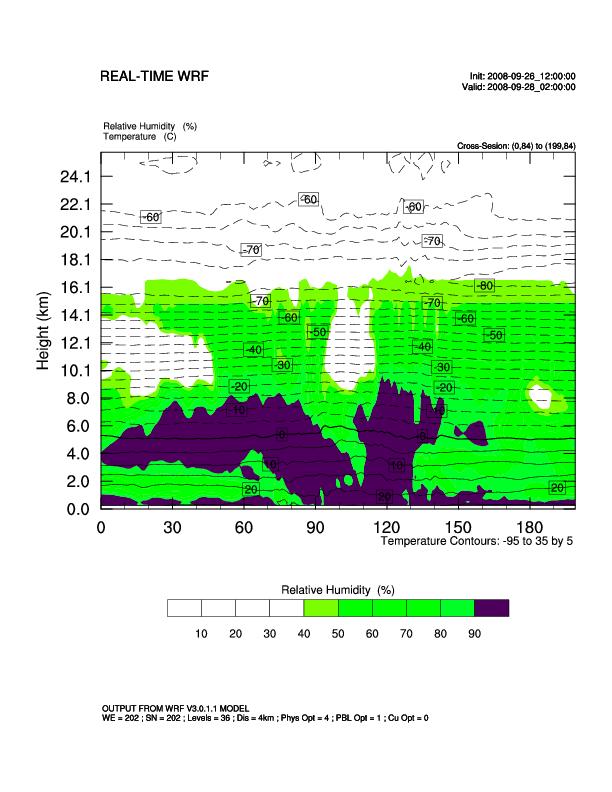
:
The wrf_CrossSection2.ncl Script was modified to produce one image per timestep, based on typhoon Jangmi.
The vertical slice has been set to be the full X-Z size of the domain,at y-coordinate 84.
 [wrf_CrossSection2_Final.ncl]
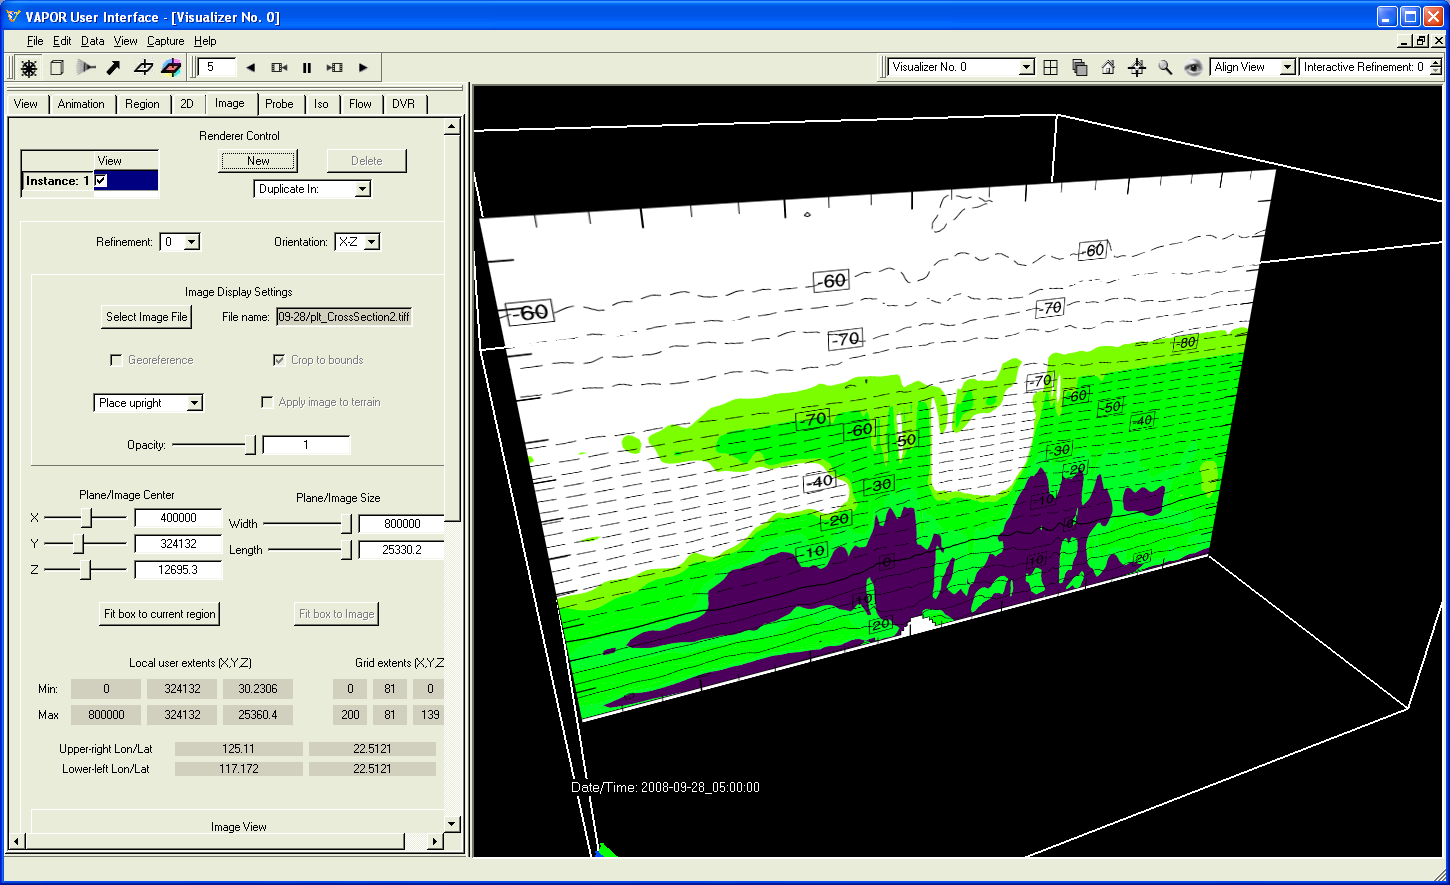
:
The wrf_CrossSection2.ncl script is then modified to produce tiff image at each timestep.
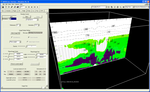
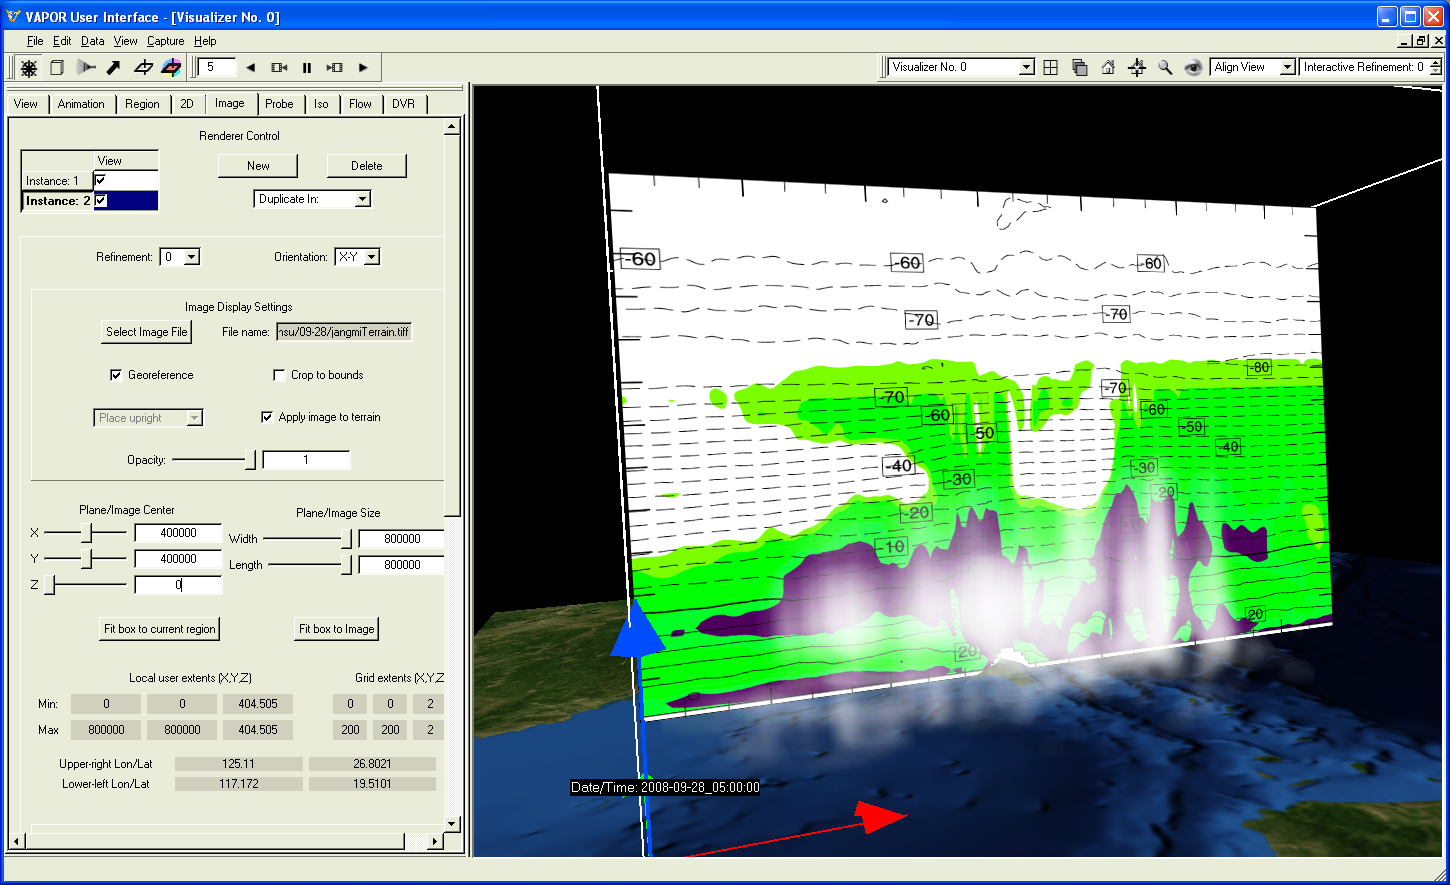
Note that, because this is a vertical slice, there is no georeferencing.
Then the resulting images are inserted into VAPOR scene, at the corresponding y-coordinate.
 [crossSection2.vss]
:
The wrf_CrossSection2.ncl tiff image is combined with a satellite image and a volume rendering of QCLOUD in a vapor scene. The vapor session file "crossSection2.vss" can be used to specify the VAPOR settings for this scene.
