NCL Home>
Application examples>
Models ||
Data files for some examples
Example pages containing:
tips |
resources |
functions/procedures
NCL: WRF plotting - zooming in on maps
This page illustrates different ways to zoom in on
WRF-ARW plots drawn over maps.
Currently, three methods are illustrated below:
- Using wrf_contour or
wrf_vector with
wrf_map_overlays to plot the data,
which uses the native WRF map projection defined on the file.
- Using gsn_csm_contour_map
with wrf_map_resources
to plot the data in the native WRF map projection defined
on the file.
- Using gsn_csm_contour_map to
plot the data, but in a different projection than what is defined on
the file.
The first two methods require setting the special ZoomIn option
to True, and setting the Xstart, Xend, Ystart,
and Yend options as described below.
The second method requires that you read the latitude / longitude
variables off the WRF file (they usually have names like "XLAT" and
"XLONG").
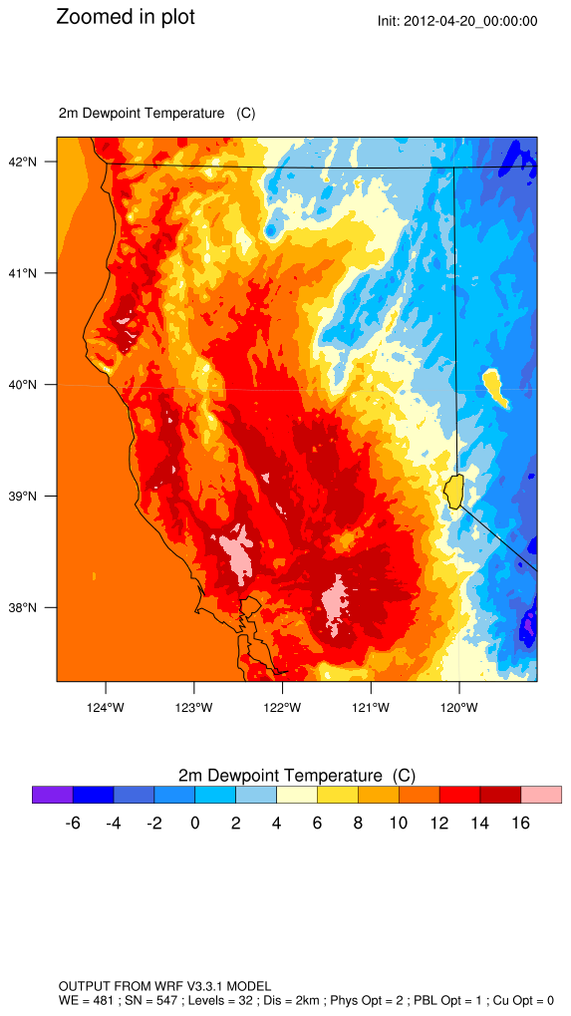
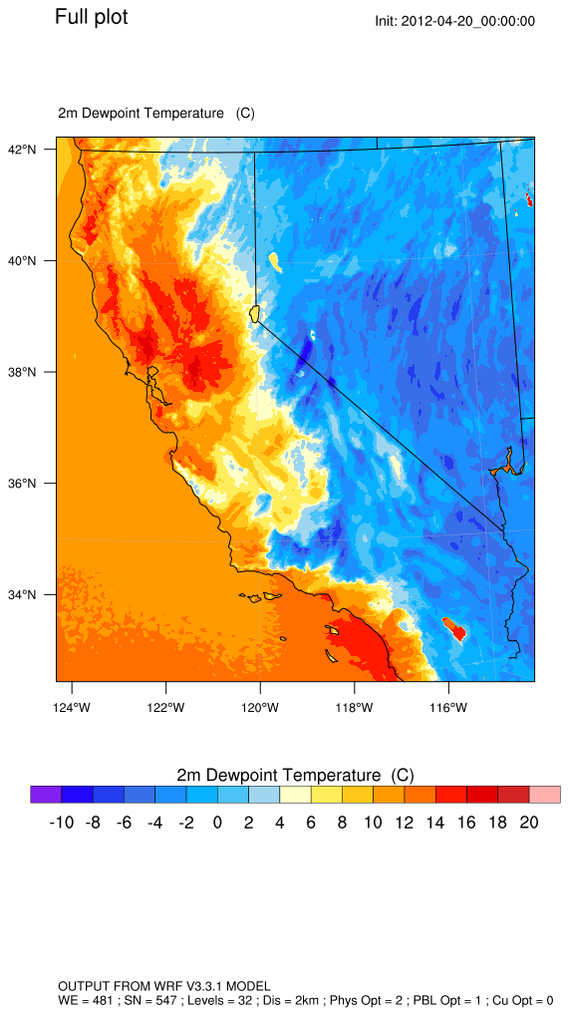
 wrf_zoom_1.ncl
:
This script creates two plots using wrf_
xxxx plotting functions:
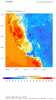
- A simple filled contour plot of the HGT variable read off a WRF output file.
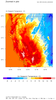
- The same data, but zoomed in on the upper left corner of the map.
In order to zoom in on WRF-ARW data and keep the same map projection
that is defined on the file, you must:
- Calculate the indexes of the zoomed in area of interest.
- Use the indexes to subset the variable(s) you are interested in
plotting, before
calling wrf_contour or
wrf_vector.
- Use the same indexes for setting the
special Xstart, Xend, Ystart, and Yend
resources, and set the special ZoomIn resource to True before
calling
wrf_map_overlays.
A Python version of the wrf_zoom_1_2 projection is available here.
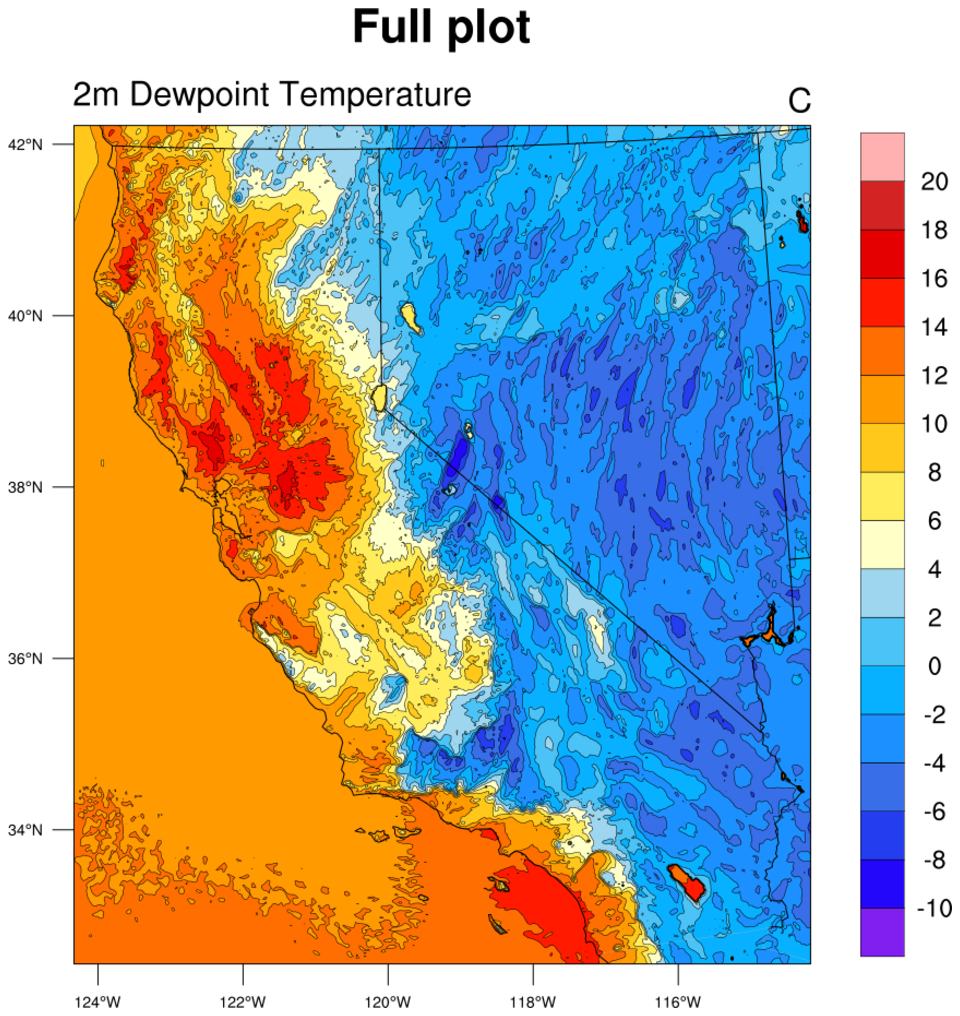
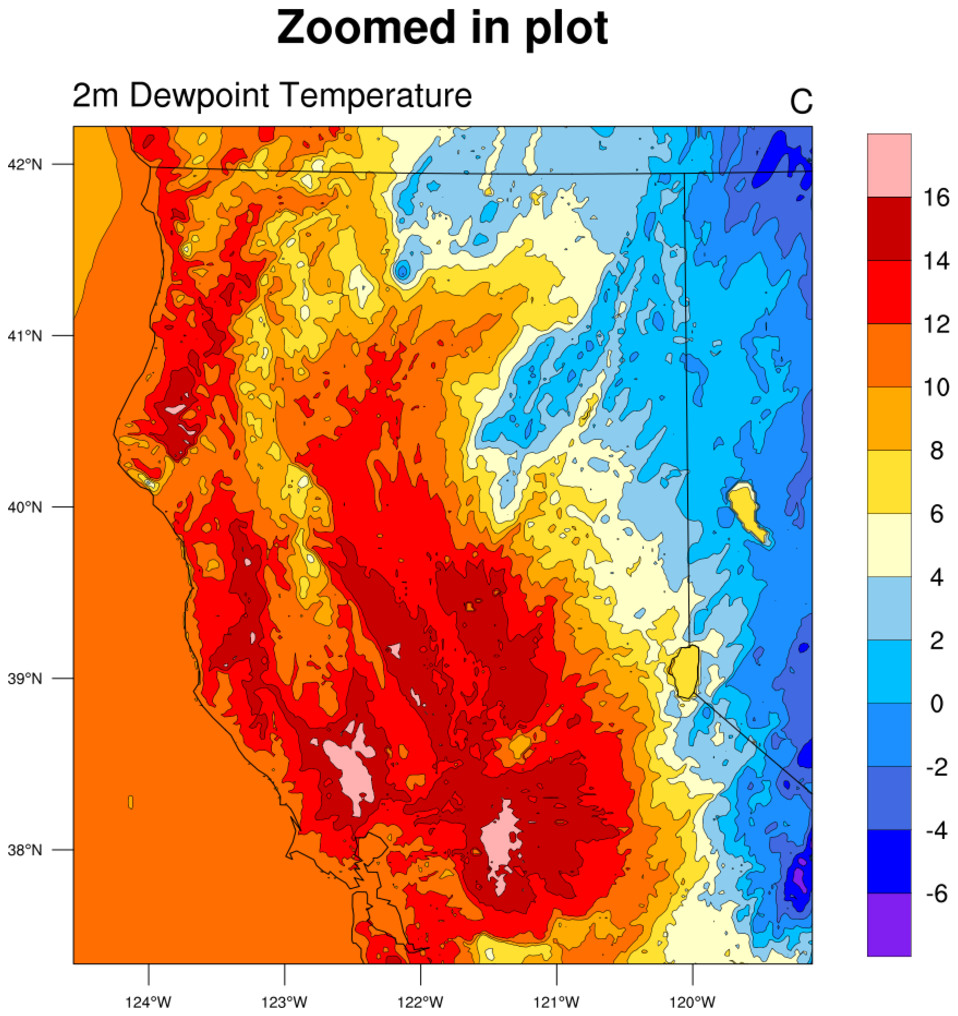
 wrf_zoom_2.ncl
: This example
plots the same data as the previous example, except this time
gsn_csm_contour_map is used to plot the data.
The data is still being plotted in the native WRF map projection, so
you must call wrf_map_resources
in order to set the correct map resources. You must also call this
function after setting the ZoomIn / Xstart / Xend /
/ YStart / YEnd resources, or the map won't be properly
zoomed.
The reason for using gsn_csm_contour_map
instead of wrf_contour
and wrf_map_overlays is simply if you don't want
all the extra titles and layout that the wrf_xxxx functions give you.
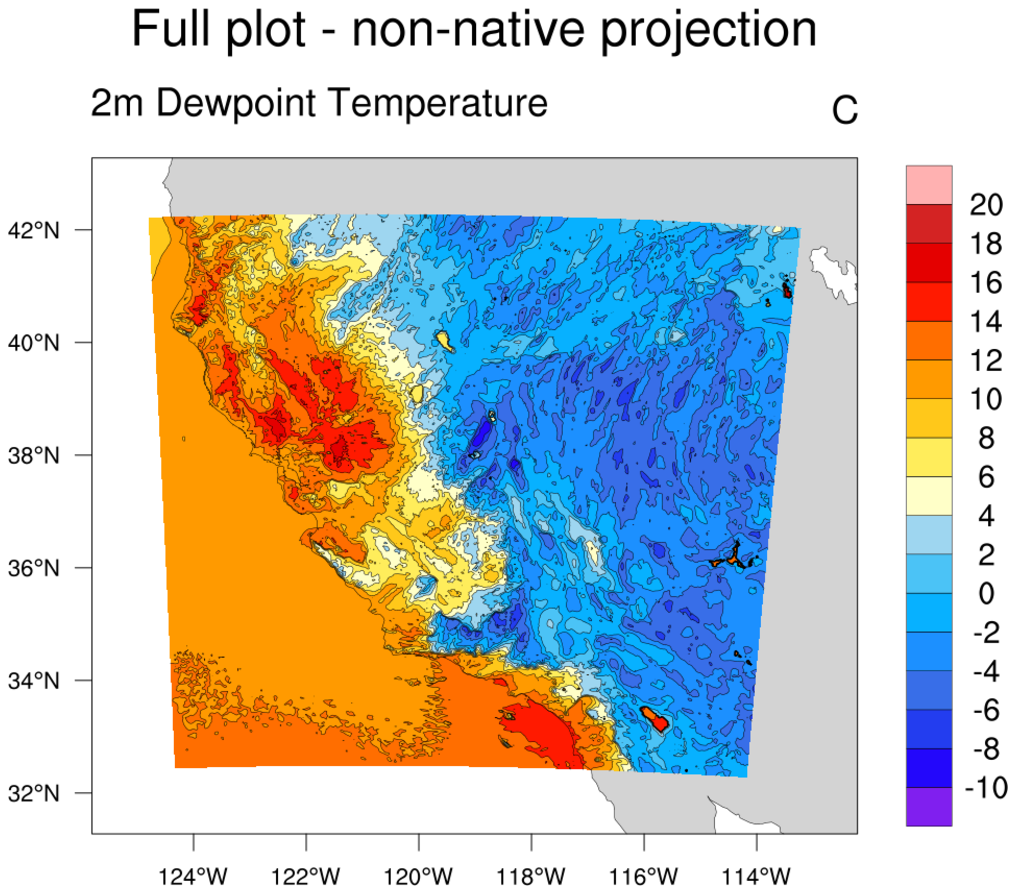
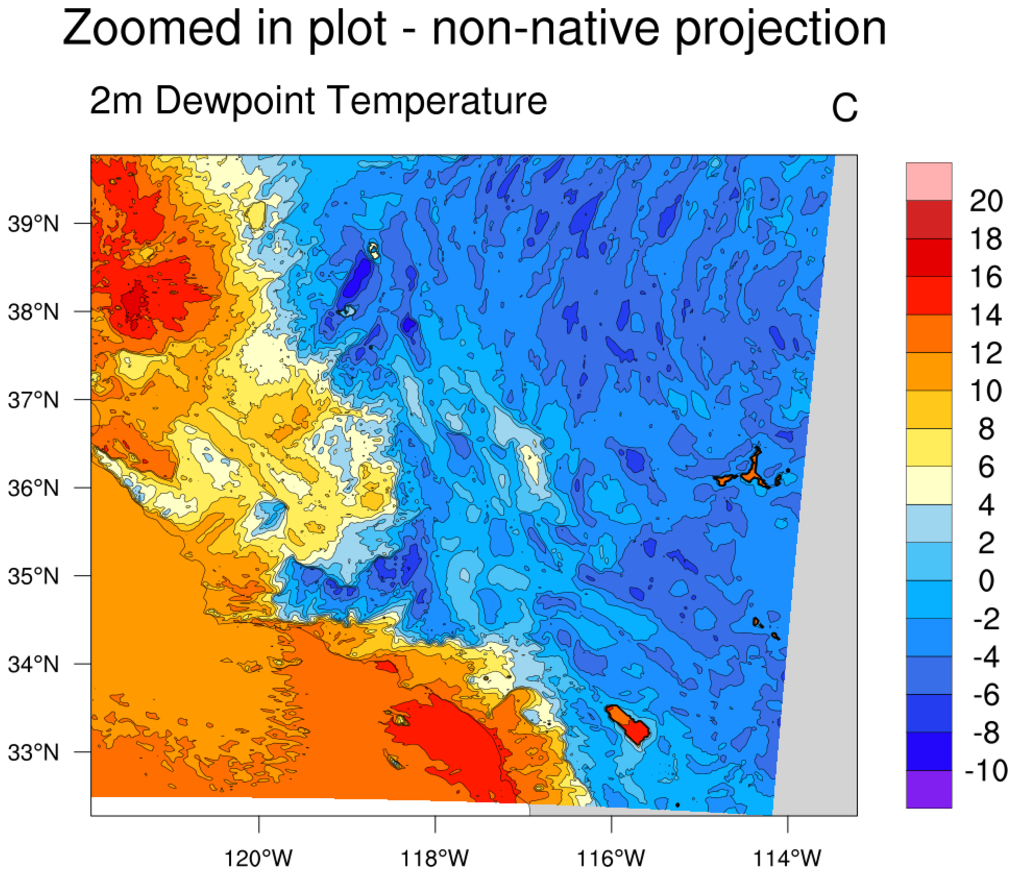
 wrf_zoom_3.ncl
: This
example plots the same data as the previous two examples, except
the data is overlaid on a standard lat/lon map projection.
In order to plot data in a non-native projection, you must:
- Read the 2D lat/lon arrays off the file and attach them as special
lat2d / lon2d attributes to the data being plotted.
- Zoom in on the area of interest by setting desired NCL map resources.
You no longer need to
call wrf_map_resources or set the
special ZoomIn/X/YStart/End resources when zooming in.
Note that if you plot WRF-ARW data in a different map projection than
what's defined on the WRF file, you may see the grid is slightly skewed.
The results are still correct, but the image will be oriented a little
differently.
The reason for plotting WRF-ARW data in a non-native projection may be
if you need to compare WRF data to another data variable that is
defined on a different map projection.
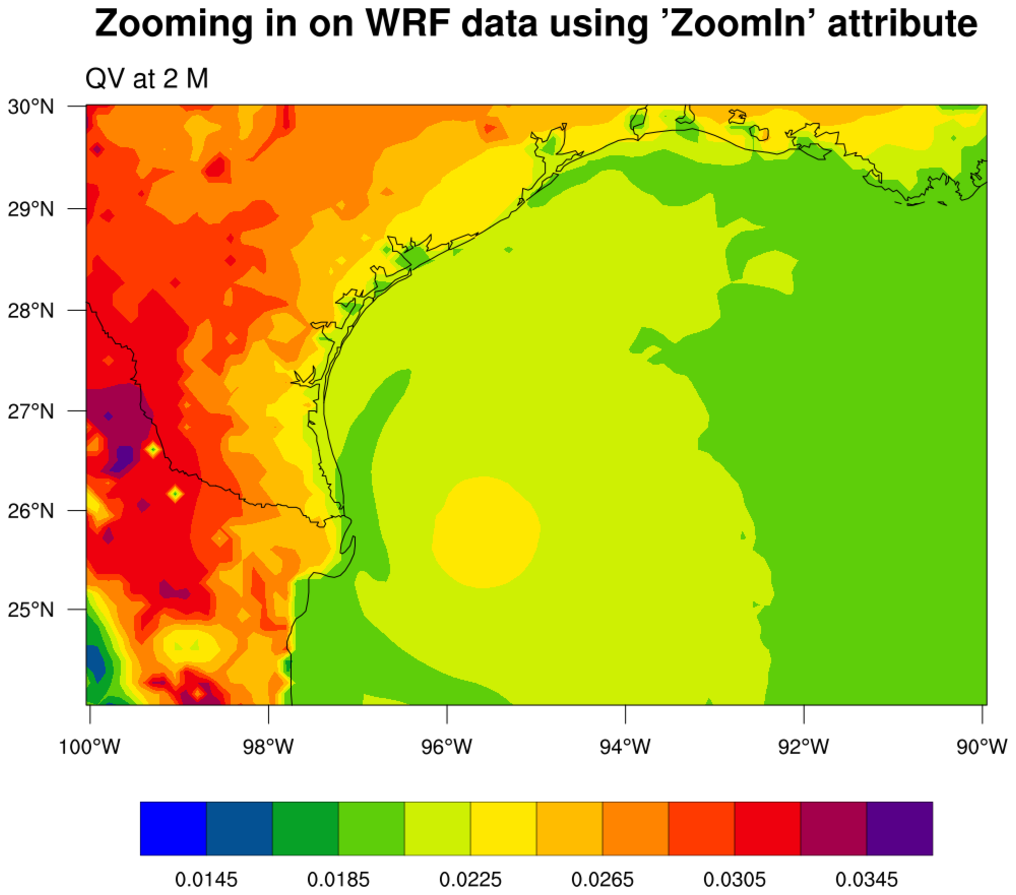
 dataonmap_zoom_10.ncl
Curvilinear grid
dataonmap_zoom_10.ncl
Curvilinear grid
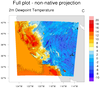
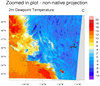
Data: wrfout_d01_2003-07-15_00:00:00 (NetCDF WRF output file)
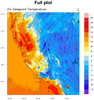
This example plots the Q2 variable read off a WRF output file and
illustrates yet another way to zoom in on the data, by actually
selecting a lat/lon area of interest, instead of "the upper left domain"
like the previous examples.
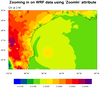
This example shows two ways to zoom in on WRF-ARW data: 1) using the
same native WRF map projection, or 2) plotting the data in a different
map projection.
The first plot shows how to plot the data in the native map
projection by first using the
wrf_user_ll_to_xy function to
calculate the x,y index locations into the 'q2' array that represent
the approximate lat/lon area of interest. These index values are used
with the ZoomIn resource to set the special Xstart, Xend,
Ystart, and Yend resources before you call
wrf_map_resources to set the
correct NEW native map projection parameters.
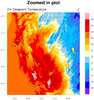
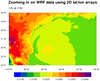
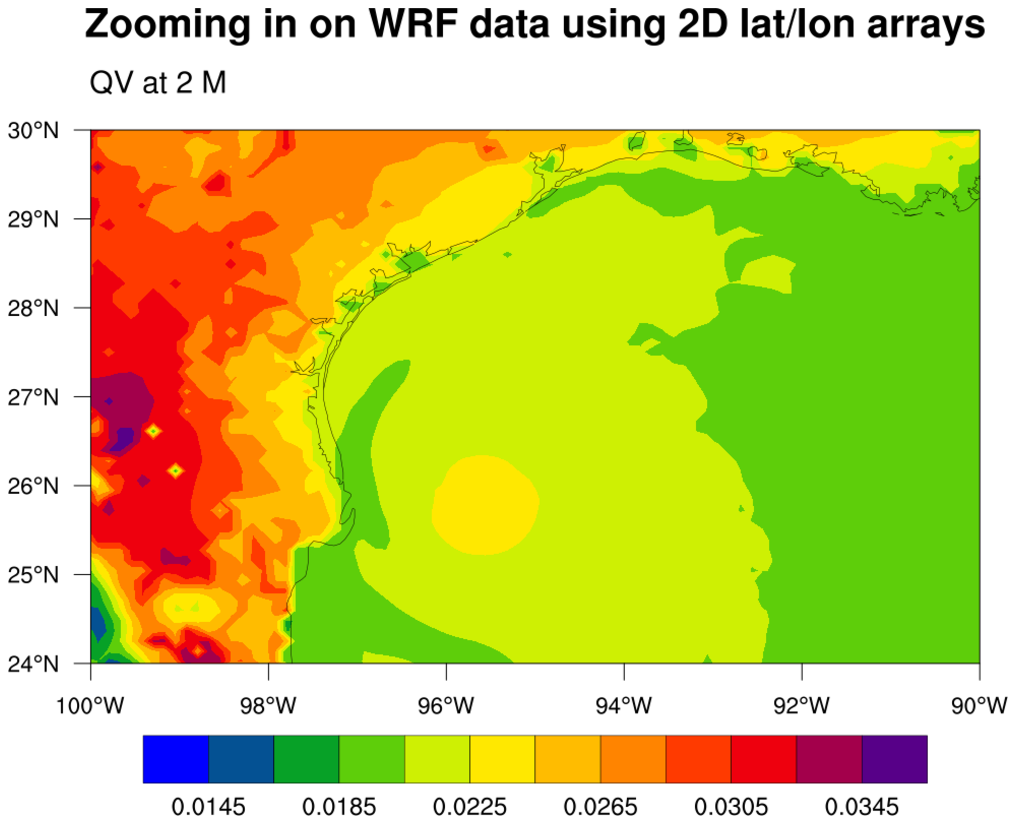
The second plot shows how to plot the data using the 2D lat/lon arrays
read off the file. In this case, you don't need the special index
values, because NCL will use the lat/lon arrays to figure out the
correct subset of the data to plot.
You may notice that the two plots are not plotted in the exact same
lat/lon area. This is because the lat/lon corners of the first plot
are only *approximately* equal to the requested lat/lon area of
interest. The wrf_user_ll_to_xy
function gives you the x,y indexes that are closest to the actual
lat/lon area of interest.
The second plot is the exact area requested, because NCL now has the
actual lat/lon arrays, and can use this to interpolate the data
as needed, in the area of interest.
For another example of subsetting a WRF map domain, see the
"wrf_Zoom.ncl" example
at http://www2.mmm.ucar.edu/wrf/OnLineTutorial/Graphics/NCL/Examples/SPECIAL/wrf_Zoom.htm