NCL > Application examples > Basic examples
Basic example 3
How to set resources for a plot
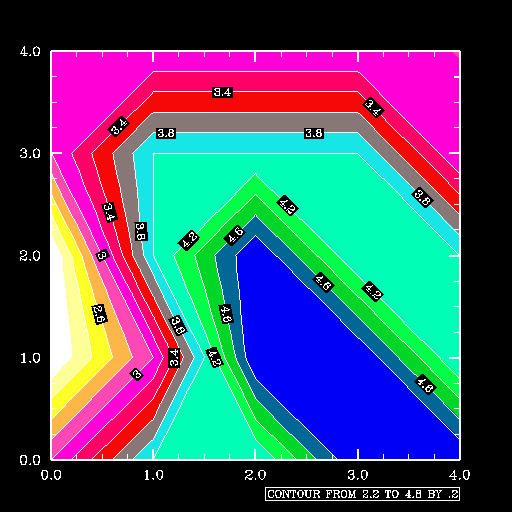
This is an introductory example that shows how to set resources with a resource file, with arguments to the function that creates an object, and with arguments to the setvalues function after an object has been created. This example demonstrates how to create the plot using NCL, HLU C, and HLU FORTRAN library calls. The names of the example codes that create this plot are basic03n.ncl, basic03c.c, and basic03f.f.
Discussion
This module discusses the different methods for setting resources in a plot using HLU C library calls, HLU FORTRAN library calls, and the NCAR Command Language. Resources are parameters that control the characteristics of a plot, such as the size, colors, line patterns, etc. The example produces four frames that are drawn into X Windows.Resources are controlled through resource files and by setting their values explicitly in an NCL script or HLU source code. For a detailed explanation about resources and how to set them, see the Understanding resources module.
The first frame of the example shows how to draw a contour plot using all the default settings except for the input data field.
The second frame of the example is drawn into a new window and uses a resource that is set in the basic03.res resource file. Only one resource, cnFillOn, is set in this file. This resource turns on contour fill for the object.
The third frame of the example draws the same contour plot and uses the resource that is set in the resource file. However, in this example, a resource is set explicitly when the object is created. The resource, cnLineLabelsOn, controls whether or not the contour line labels are visible. In this case, the resource is set to "False" so the labels will not appear.
In the fourth frame of the example, a resource is set using the setvalues call that overrides the resource setting in the resource file. In this example,>setvalues is used to set the cnFillOn resource to "False" to turn off contour fill.
A detailed discussion about how to create the plot appears in the comments of the source code for the example.
Creating the plot using HLU C library calls
The HLU C program that generates this plot is called basic03c.c.
Creating the plot using HLU FORTRAN library calls
The HLU FORTRAN program that generates this plot is called basic03f.f.
Creating the plot using NCL
The HLU NCL program that generates this plot is called basic03n.ncl.
The data
The data for this plot was generated internally in the NCL script and in the HLU source codes. The data is a 5x5 array of integer values.
How to run this example
This example can be produced using an NCL script (basic03n.ncl), a C program (basic03c.c), or a FORTRAN program (basic03f.f). The examples are installed in the following locations:
- $NCARG_ROOT/lib/ncarg/nclex/basic/basic03n.ncl
- $NCARG_ROOT/lib/ncarg/hluex/basic/basic03c.c
- $NCARG_ROOT/lib/ncarg/hluex/basic/basic03f.f
