NCL > Application examples > Basic examples
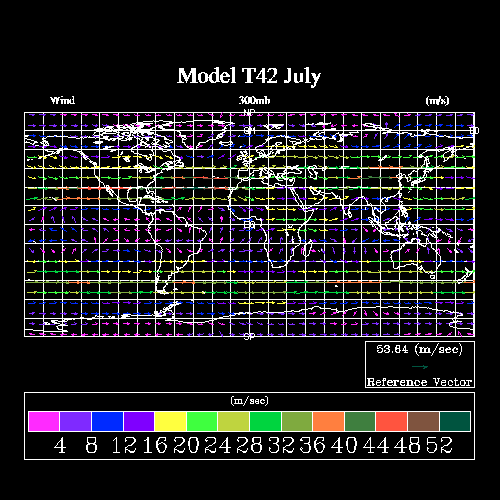
VectorPlot example 8
How to plot vectors and color them by wind speed
This example can be created using HLU function calls or NCL. It plots wind vectors at a grid stride of 3 and colors them according to wind speed. The names of the source files for this example are vc08c.c, vc08f.f, and vc08n.ncl.
Discussion
This module discusses how to create this plot using NCL or HLU C or FORTRAN calls. A resource file is not included with this example. A detailed discussion of how this example works appears in its source code.
Creating the plot using HLUs
The HLU C program that generates this plot is called vc08c.c.
Creating the plot using HLU FORTRAN library calls
The HLU FORTRAN program that generates this plot is called vc08f.f.
Creating the plot using NCL
The NCL script that generates this plot is called vc08n.ncl.
The data
The data for this plot is from a netCDF file (created by NCL) called ex01B1_uv300.hs.ncThe data file is located in your NCAR Graphics data directory in a subdirectory called "cdf". You can get the name of the data directory by typing "ncargpath data" at your shell prompt. If you have netCDF installed on your system, then you can change directory to where the netCDF file resides and type "ncdump -h ex01B1_uv300.hs.nc" to view the header information for this data file.
How to run this example
This example can be created using a C program (vc08c.c), a FORTRAN program (vc08f.f), or an NCL script (vc08n.ncl). The example is installed in the following locations:
- $NCARG_ROOT/lib/ncarg/hluex/vectorplot/vc08c.c
- $NCARG_ROOT/lib/ncarg/hluex/vectorplot/vc08f.f
- $NCARG_ROOT/lib/ncarg/nclex/vectorplot/vc08n.ncl
- $NCARG_ROOT/lib/ncarg/data/cdf/ex01B1_uv300.hs.nc