NCL > Application examples > Basic examples
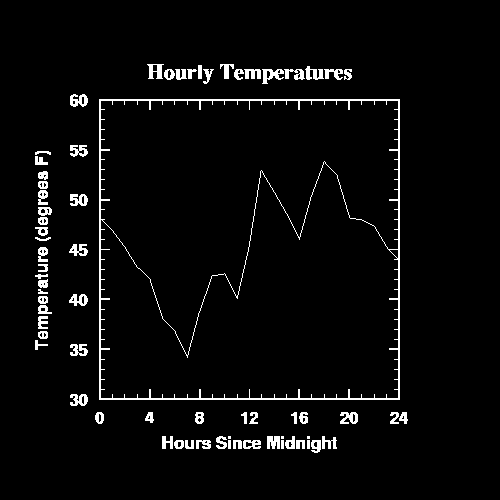
XyPlot example 14
How to manipulate XyPlot data using NCL
This example can be created using HLU C library calls, HLU FORTRAN library calls, or NCL. It demonstrates the data manipulation capabilities available in NCAR Graphics and how to create data objects. The names of the source files for this example are xy14c.c, xy14f.f, and xy14n.ncl.
Discussion
This module discusses how to create this plot using HLU function calls or NCL, and it demonstrates some of the data manipulation capabilities that are available with NCAR Graphics. The example creates a series of plots that use CoordArrays objects for managing data.The NCL version of this example also demonstrates how to use some of the data manipulation features and functions of the language to subsample or thin data and perform conversions and other mathematical operations on the data.
A resource file is not used with this example.
A detailed discussion of how this example works appears in its source code.
Creating the plot using HLU C library calls
The HLU C program that generates this plot is called xy14c.c.
Creating the plot using HLU FORTRAN library calls
The HLU FORTRAN program that generates this plot is called xy14f.f.
Creating the plot using NCL
The NCL script that generates this plot is called xy14n.ncl.
The data
The data for this plot is generated from within the program.
How to run this example
The examples are installed in the following locations:
- $NCARG_ROOT/lib/ncarg/hluex/xyplot/xy14c.c
- $NCARG_ROOT/lib/ncarg/hluex/xyplot/xy14f.f
- $NCARG_ROOT/lib/ncarg/nclex/xyplot/xy14n.ncl
