NCL > Application examples > Basic examples
XyPlot example 17
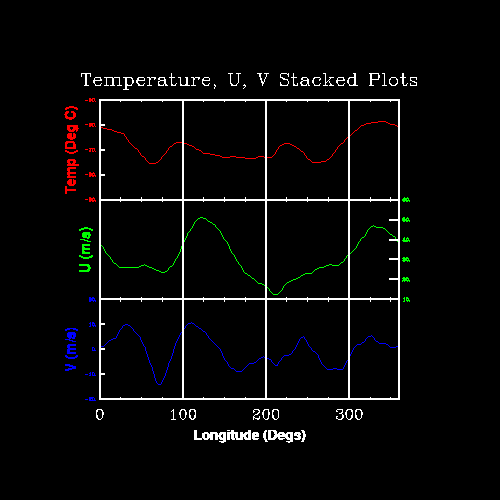
Creating stacked plots
This example is created using HLU C library calls, HLU FORTRAN library calls, or NCL. It demonstrates how to create an XyPlot that has three stacked y axes. The names of the source files for this example are xy17c.c, xy17f.f, and xy17n.ncl.
Discussion
This example reads an ASCII file with 4 variables: lon, u, v, and t. The variables u, v, and t are stacked, each sharing the same X axis, and having their own Y axis.There is no resource file with this example.
Creating the plot using HLUs
The HLU C program that generates this plot is called xy17c.c.
Creating the plot using HLU FORTRAN library calls
The HLU FORTRAN program that generates this plot is called xy17f.f.
Creating the plot using NCL
The NCL script that generates this plot is called xy17n.ncl.
The data
The data for this plot is from a file called "xy.asc".
How to run this example
The examples are installed in the following locations:
- $NCARG_ROOT/lib/ncarg/hluex/xyplot/xy17c.c
- $NCARG_ROOT/lib/ncarg/hluex/xyplot/xy17f.f
- $NCARG_ROOT/lib/ncarg/nclex/xyplot/xy17n.ncl
- $NCARG_ROOT/lib/ncarg/data/asc/xy.asc