NCL Home>
Application examples>
Special plots ||
Data files for some examples
Example pages containing:
tips |
resources |
functions/procedures
NCL Graphics: Boxplots
Note: You must load
shea_util.ncl
to use the
boxplot function.
This function does not draw the boxplot or advance the frame, so
you must do this yourself by calling draw and
frame after the boxplot is created.
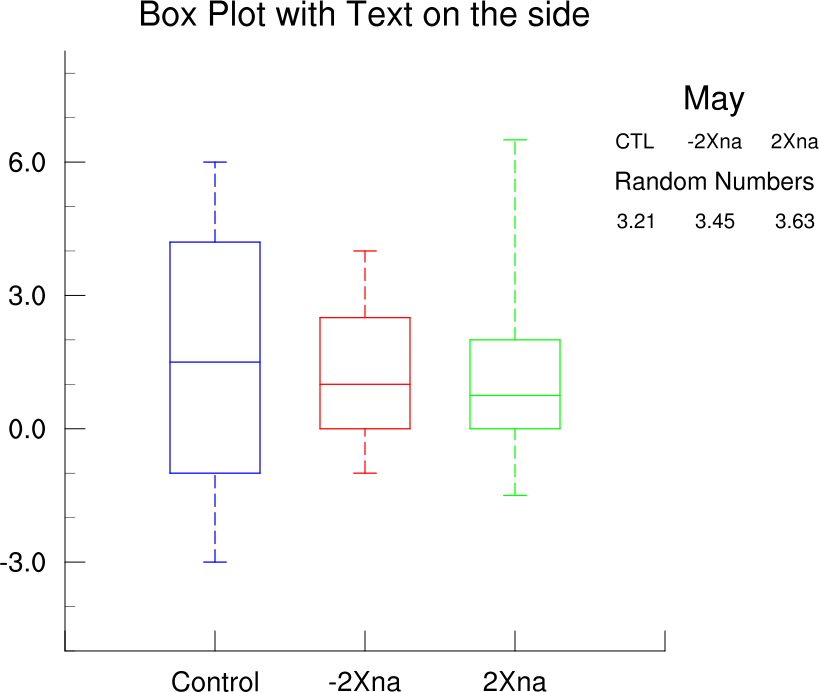
As the boxplot code does not use a gsn drawing function to construct
the boxplot, note that the resources gsnLeftString, gsnCenterString, and gsnRightString will not work with the boxplot
function. However, you can see example
12 on the text page if you need to
mimic these three resources.
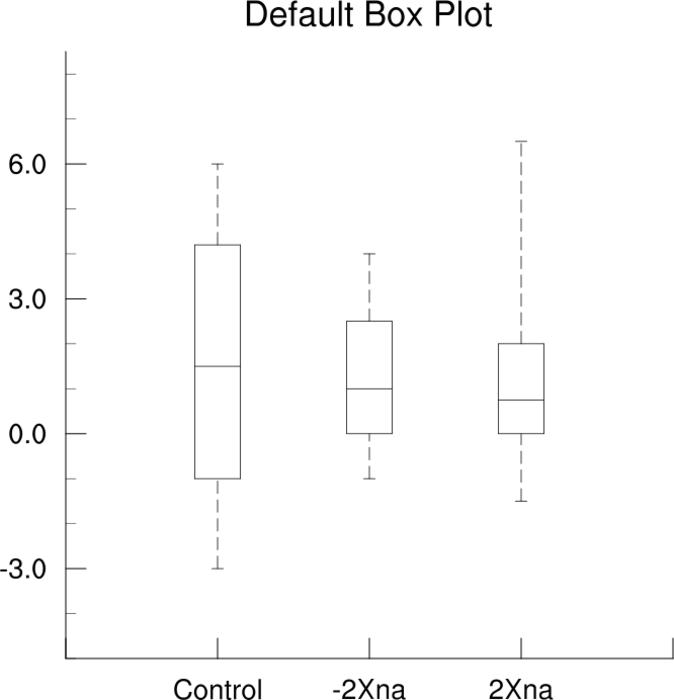
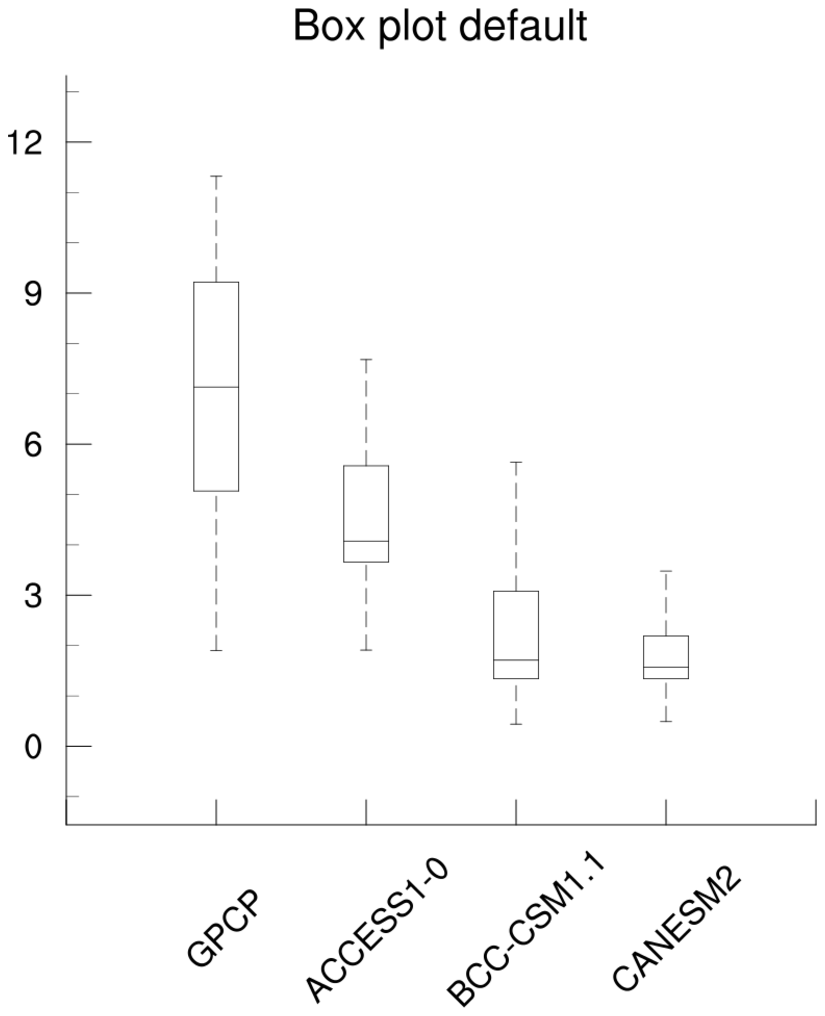
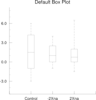 box_1.ncl
:
Default box plot.
A Python version of this projection is available here.
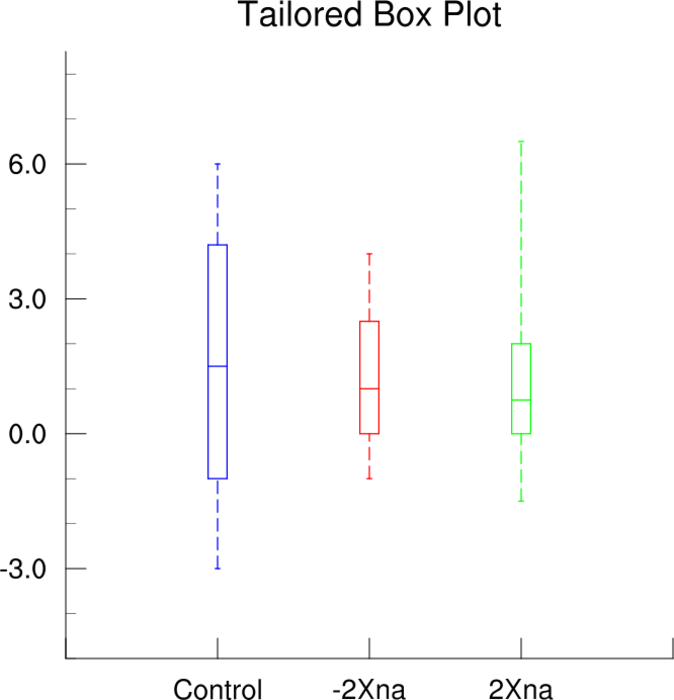
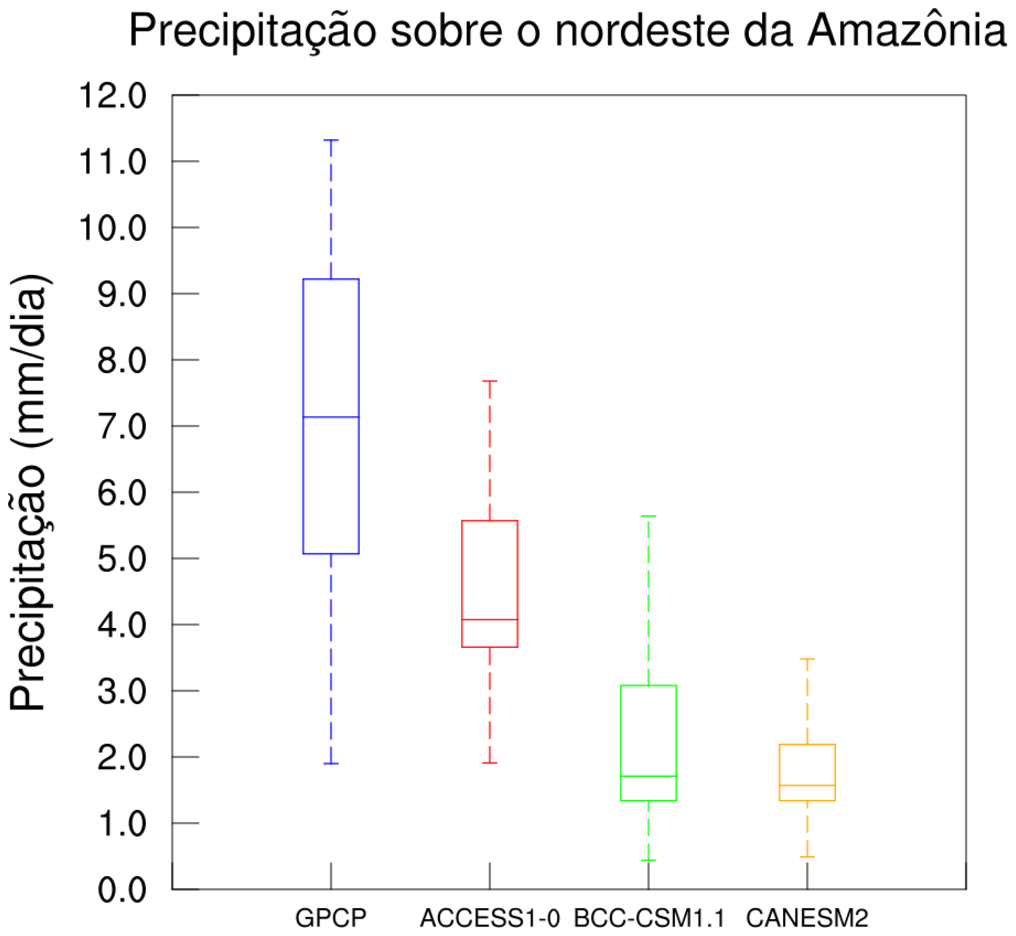
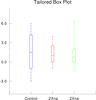 box_2.ncl
:
Demonstrates how to set the color and line thicknesses of individual
box plots.
gsLineThicknessF will set
the line thickness of the boxes.
boxWidth and boxColors are function local resources that allow you
to set width and color of the boxes.
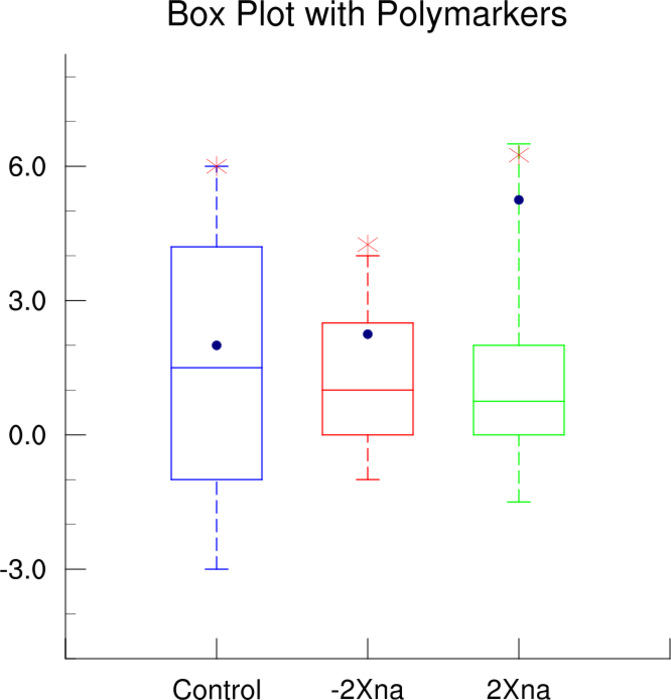
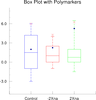 box_3.ncl
:
Adds some polymarkers.
Uses gsn_add_polymarker to put
the polymarkers on the plot. Recall that this a function that
must be set to a dummy variable which is never deleted before the
plot is created. A Python version of this projection is available here.
As of V5.1.0, the
special gsnMaximize resource is
recognized to allow you to maximize the size of the box plot,
which is used in this example.
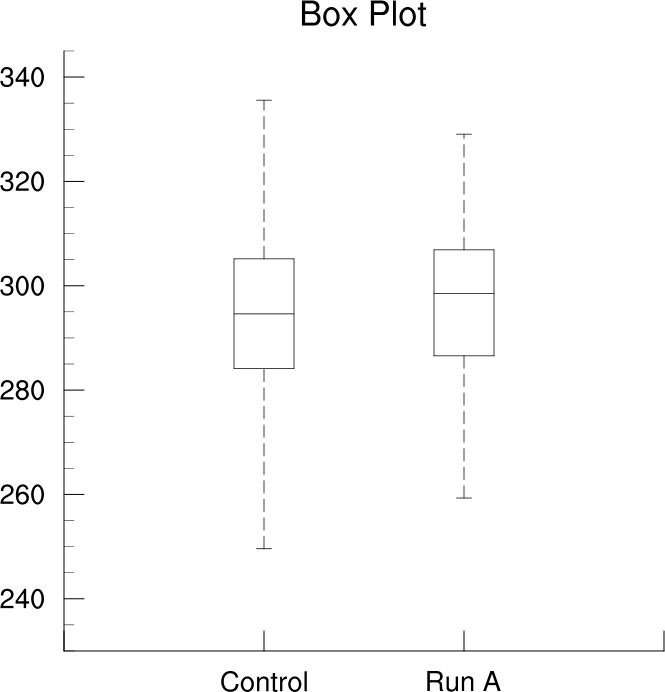
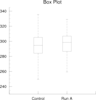 box_5.ncl
:
Shows how to calculate and plot the median, minimum value, maximum value, and the 25th and 75th percentiles of two
timeseries.
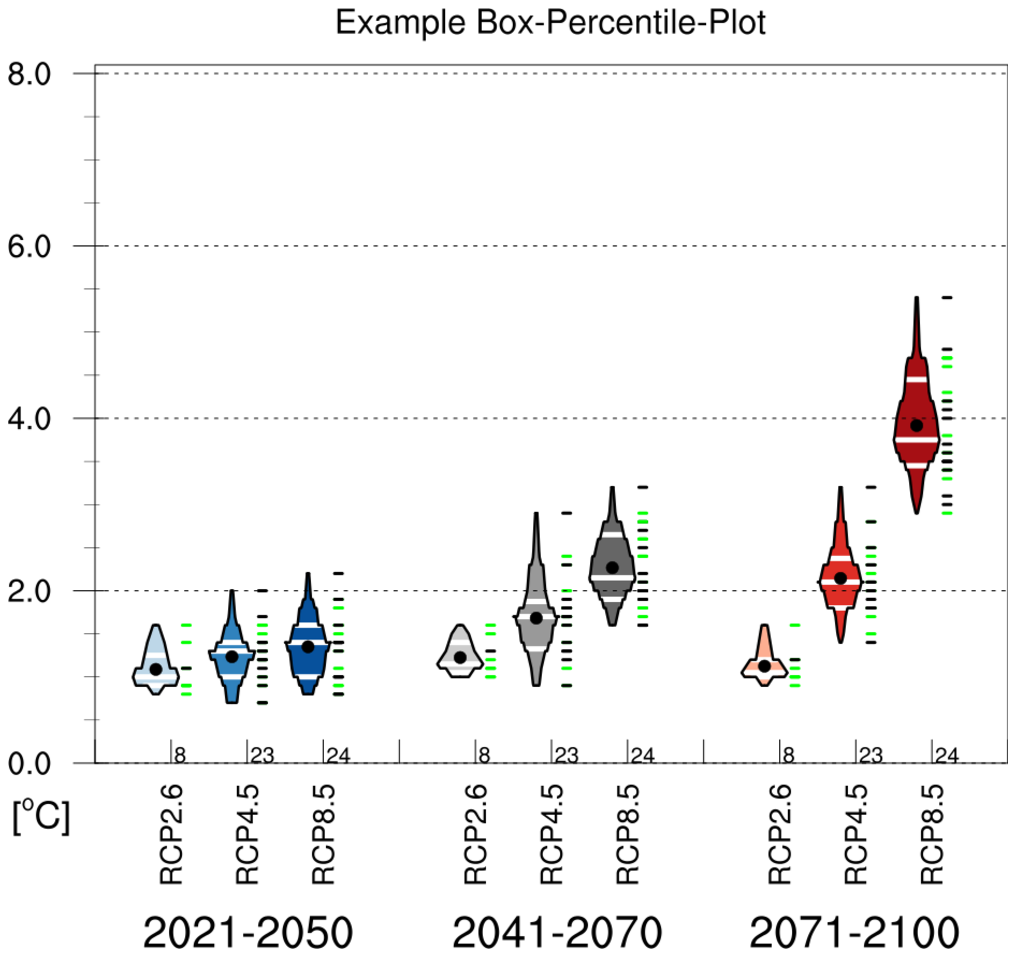
 box_8.ncl
:
This example shows how to create a box percentile plot, which is based on
Esty WW, Banfield J: The box-percentile plot. J Statistical Software 8 No. 17, 2003. (http://www.jstatsoft.org/v08/i17).
You must download the
box_percentile_plot.ncl
script in order to run this example.
This code was contributed by Frank Kreienkamp of DWD, which is based on
code contributed by Carl Schreck and Adam Phillips.