NCL Home>
Application examples>
gsn_csm graphical interfaces ||
Data files for some examples
 conwomap_1.ncl:
The first frame shows a default black and white contour plot. You
automatically get a contour information label
(cnInfoLabelOn).
conwomap_1.ncl:
The first frame shows a default black and white contour plot. You
automatically get a contour information label
(cnInfoLabelOn).
 conwomap_2.ncl:
Changes the aspect ratio using vpWidthF and vpHeightF to better match the coordinates.
conwomap_2.ncl:
Changes the aspect ratio using vpWidthF and vpHeightF to better match the coordinates.
 conwomap_3.ncl:
Demonstrates how to mask out mirrored data using missing data.
conwomap_3.ncl:
Demonstrates how to mask out mirrored data using missing data.
 conwomap_5.ncl:
Demonstrates how to change the Y axis to a logarithmic axis, by
setting the special resource gsnYAxisIrregular2Log to True.
conwomap_5.ncl:
Demonstrates how to change the Y axis to a logarithmic axis, by
setting the special resource gsnYAxisIrregular2Log to True.
Example pages containing:
tips |
resources |
functions/procedures
NCL Graphics: Contours without maps
These examples demonstrate the use of gsn_csm_contour.
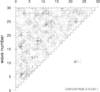
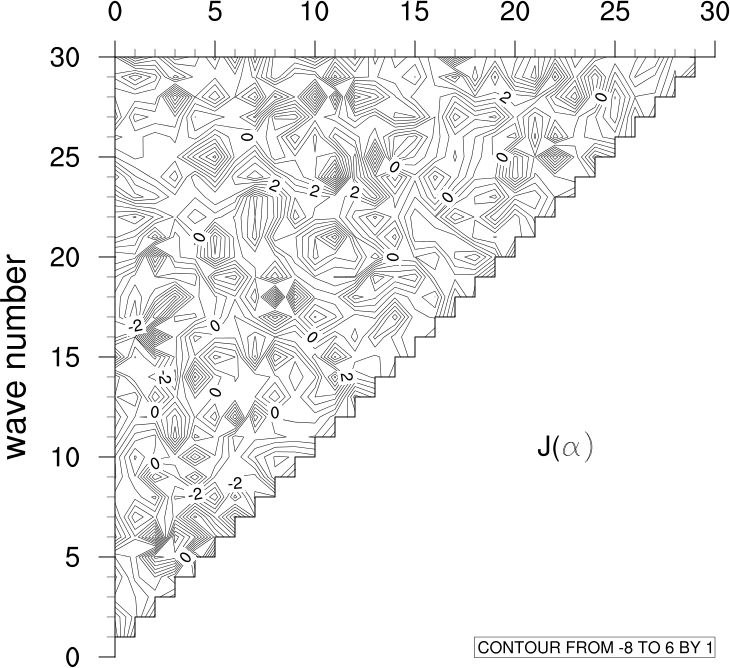
 conwomap_1.ncl:
The first frame shows a default black and white contour plot. You
automatically get a contour information label
(cnInfoLabelOn).
conwomap_1.ncl:
The first frame shows a default black and white contour plot. You
automatically get a contour information label
(cnInfoLabelOn).
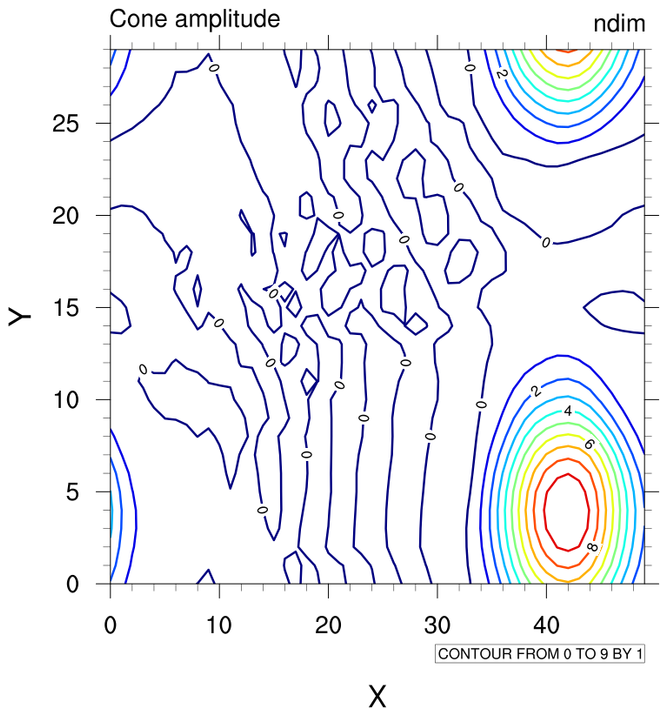
The second frame sets cnMonoLineColor to False, which forces each contour line to be drawn in a different color depending on which contour level it represents. cnLineColors is set using span_color_rgba, in order to span the NCV_jet color map, which has 256 colors.
A Python version of the colored projection is available here.
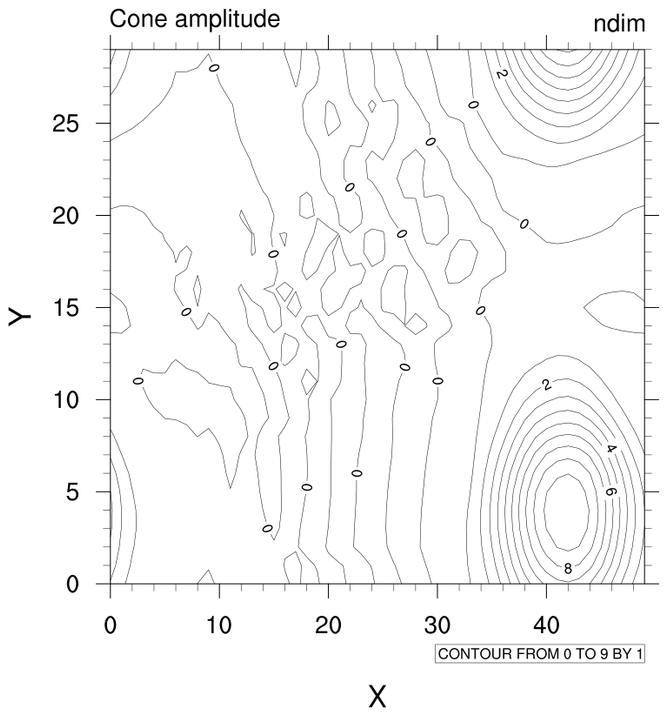
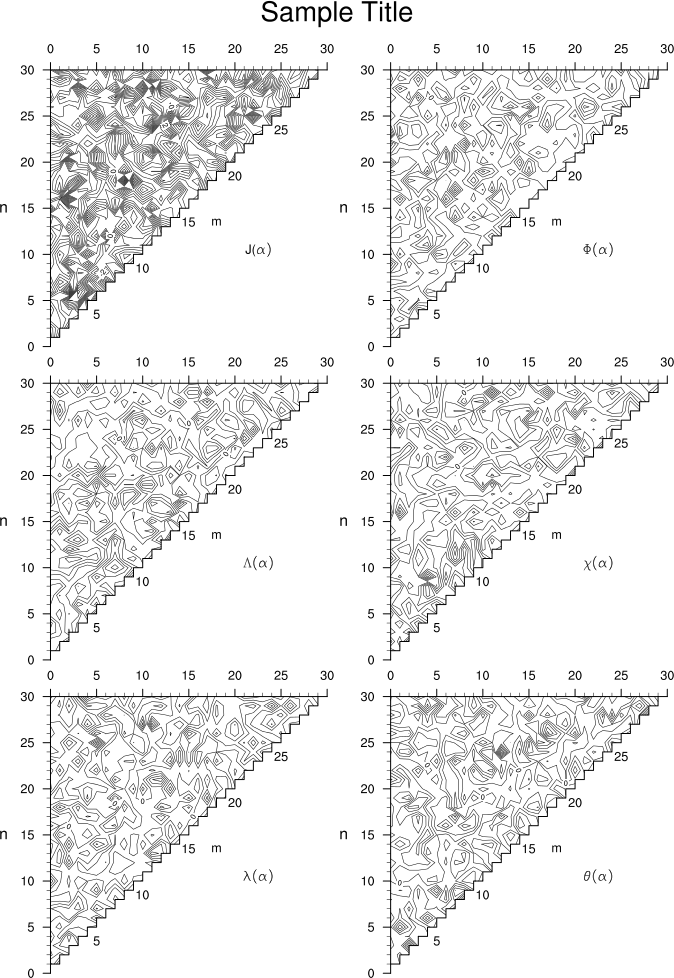
 conwomap_2.ncl:
Changes the aspect ratio using vpWidthF and vpHeightF to better match the coordinates.
conwomap_2.ncl:
Changes the aspect ratio using vpWidthF and vpHeightF to better match the coordinates.
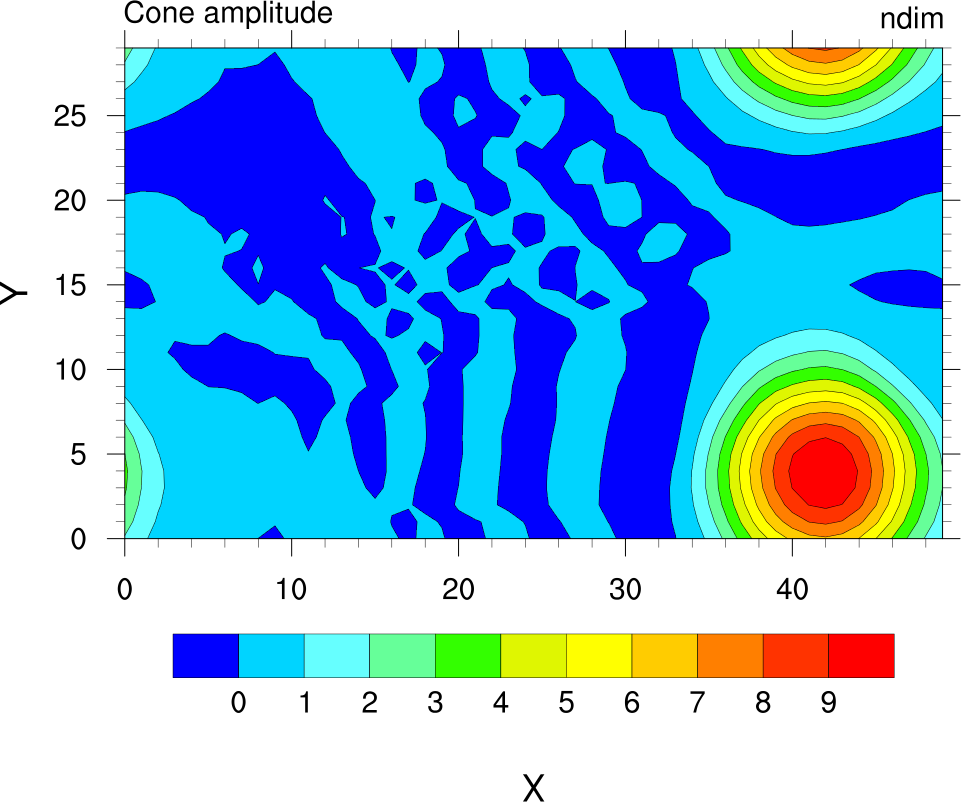
Creates color-filled contours using cnFillOn.
A Python version of this projection is available here.
 conwomap_3.ncl:
Demonstrates how to mask out mirrored data using missing data.
conwomap_3.ncl:
Demonstrates how to mask out mirrored data using missing data.
A Python version of this projection is available here.
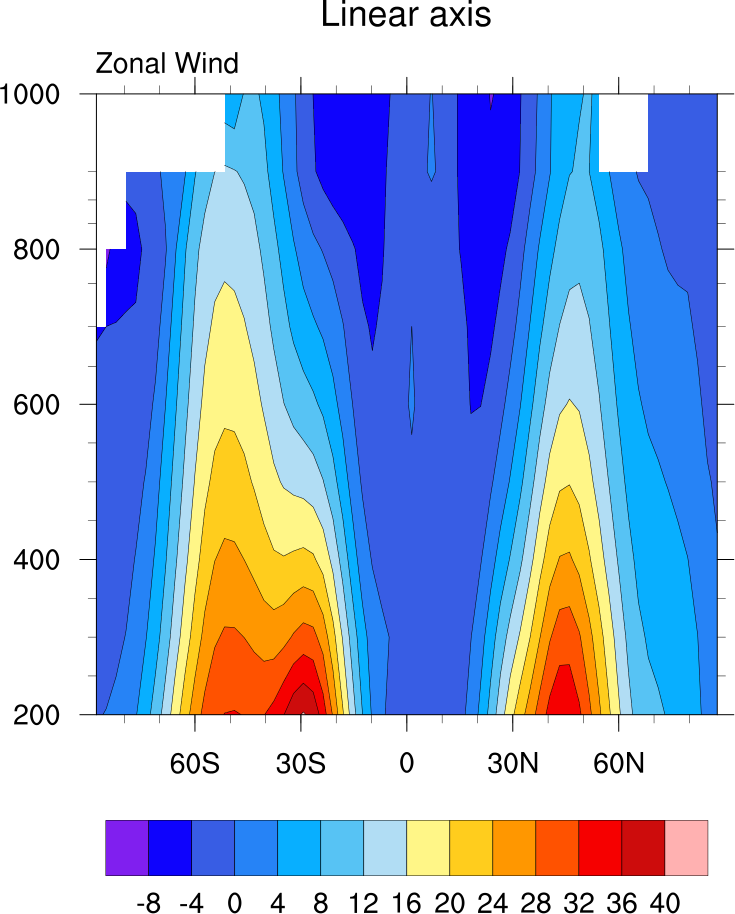
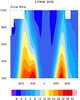
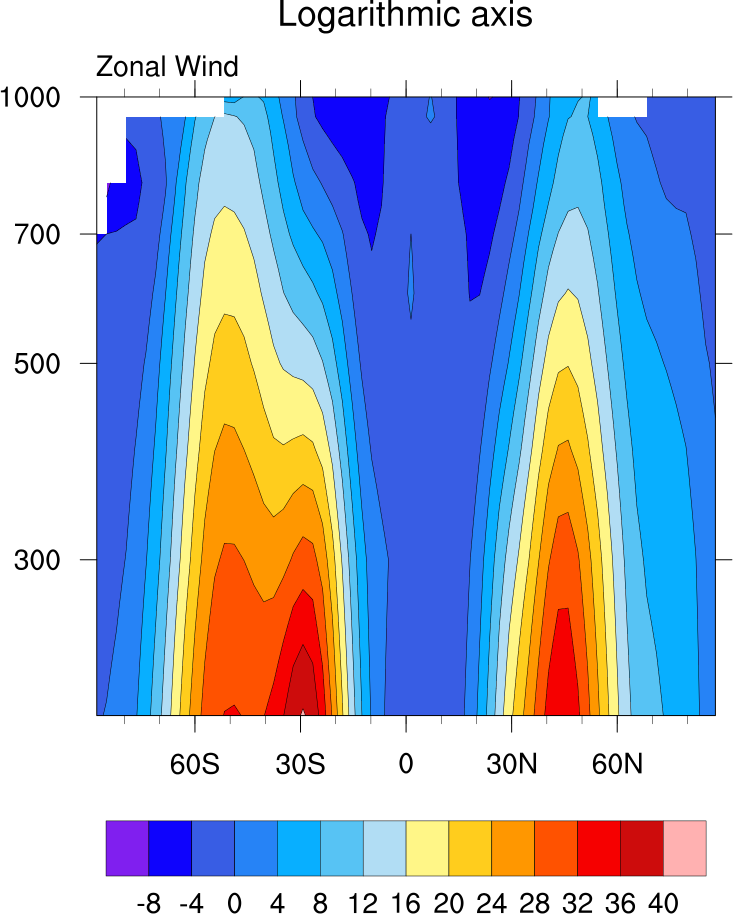 conwomap_5.ncl:
Demonstrates how to change the Y axis to a logarithmic axis, by
setting the special resource gsnYAxisIrregular2Log to True.
conwomap_5.ncl:
Demonstrates how to change the Y axis to a logarithmic axis, by
setting the special resource gsnYAxisIrregular2Log to True.