NCL Home>
Application examples>
Data sets ||
Data files for some examples

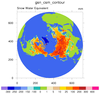
 ease_1.ncl:
This script illustrates how to create contours of an EASE grid. The
first frame is a contour plot only, and the second frame overlays the
contours on a northern hemisphere polar stereographic map. Drawing the
contours only is much quicker, and is good for quick debugging
purposes.
ease_1.ncl:
This script illustrates how to create contours of an EASE grid. The
first frame is a contour plot only, and the second frame overlays the
contours on a northern hemisphere polar stereographic map. Drawing the
contours only is much quicker, and is good for quick debugging
purposes.
 ease_2.ncl:
This plots discrete (categorical) snow extent data for Dec 25-31, 2012 rendered on a 100km resolution EASE grid.
The numbers pertain to the following categories:
10: Snow cover reported by weekly_cdr, passive_microwave, 11: Snow cover reported by weekly_cdr only, 12: Snow cover reported by passive_microwave only, 20: Snow free land, 30: Permanent ice covered land, 40: Ocean.
ease_2.ncl:
This plots discrete (categorical) snow extent data for Dec 25-31, 2012 rendered on a 100km resolution EASE grid.
The numbers pertain to the following categories:
10: Snow cover reported by weekly_cdr, passive_microwave, 11: Snow cover reported by weekly_cdr only, 12: Snow cover reported by passive_microwave only, 20: Snow free land, 30: Permanent ice covered land, 40: Ocean.
Example pages containing:
tips |
resources |
functions/procedures
NCL Graphics: EASE Grids
This page shows how to use NCL to analyze EASE (Equal-Area Scalable
Earth) grids (obtained from the National
Snow and Ice Data Center).

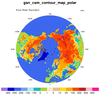
 ease_1.ncl:
This script illustrates how to create contours of an EASE grid. The
first frame is a contour plot only, and the second frame overlays the
contours on a northern hemisphere polar stereographic map. Drawing the
contours only is much quicker, and is good for quick debugging
purposes.
ease_1.ncl:
This script illustrates how to create contours of an EASE grid. The
first frame is a contour plot only, and the second frame overlays the
contours on a northern hemisphere polar stereographic map. Drawing the
contours only is much quicker, and is good for quick debugging
purposes.
In order to generate contours over a map from this kind of grid, you must set the resource trGridType to "TriangularMesh", and make sure you have the special 2D lat2d and lon2d attributes attached to the data.
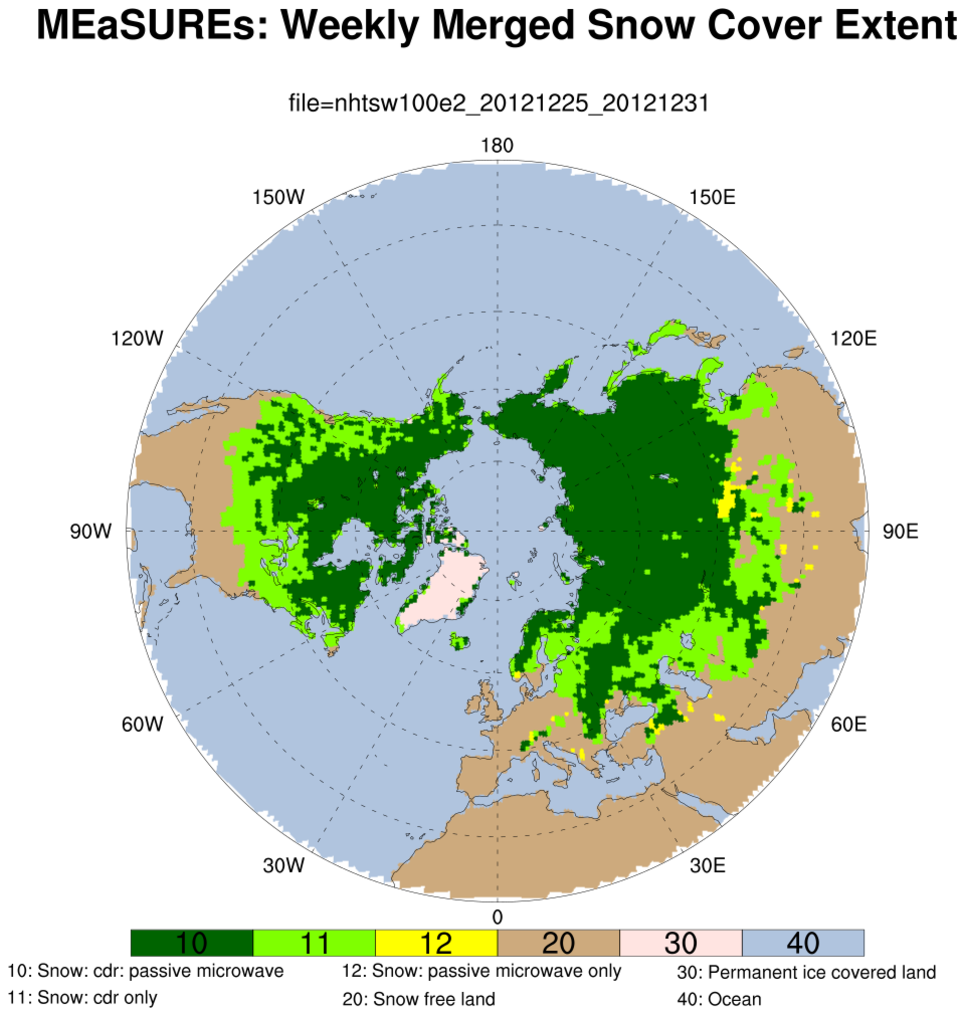 ease_2.ncl:
This plots discrete (categorical) snow extent data for Dec 25-31, 2012 rendered on a 100km resolution EASE grid.
The numbers pertain to the following categories:
10: Snow cover reported by weekly_cdr, passive_microwave, 11: Snow cover reported by weekly_cdr only, 12: Snow cover reported by passive_microwave only, 20: Snow free land, 30: Permanent ice covered land, 40: Ocean.
ease_2.ncl:
This plots discrete (categorical) snow extent data for Dec 25-31, 2012 rendered on a 100km resolution EASE grid.
The numbers pertain to the following categories:
10: Snow cover reported by weekly_cdr, passive_microwave, 11: Snow cover reported by weekly_cdr only, 12: Snow cover reported by passive_microwave only, 20: Snow free land, 30: Permanent ice covered land, 40: Ocean.
The trick of using 'cnLevels' one greater than the actual values was neeeded to get the figure.
Note: An example which shows labels on the plot is at the classification/categorical location.