In all cases, the quality of the resulting plot will be a function of the distribution of the X and Y arrays, the number of sampling points and the 'shape' of the data be contoured.
NCL Home>
Application examples>
Non-uniform grids ||
Data files for some examples
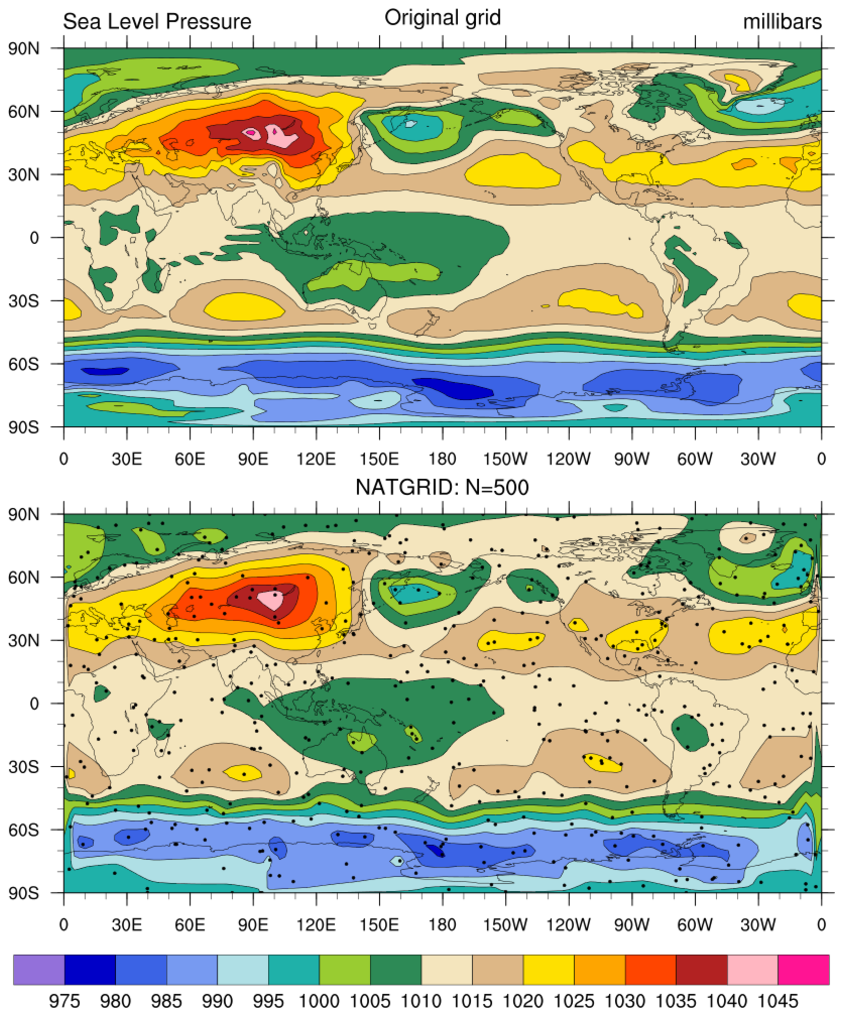
 rdm2grid_1.ncl:
Gridded sea level pressures are read; then, for demonstration
purposes, NOBS are randomly sampled from the grid using
generate_unique_indices
or random_uniform and small random location
perturbations are added. The resulting lat[*], lon[*], Z[*]
triplet is then interpolated using natgrid_Wrap.
rdm2grid_1.ncl:
Gridded sea level pressures are read; then, for demonstration
purposes, NOBS are randomly sampled from the grid using
generate_unique_indices
or random_uniform and small random location
perturbations are added. The resulting lat[*], lon[*], Z[*]
triplet is then interpolated using natgrid_Wrap.
 rdm2grid_2.ncl:
Same as Example 1 except cssgrid is used to interpolate.
rdm2grid_2.ncl:
Same as Example 1 except cssgrid is used to interpolate.
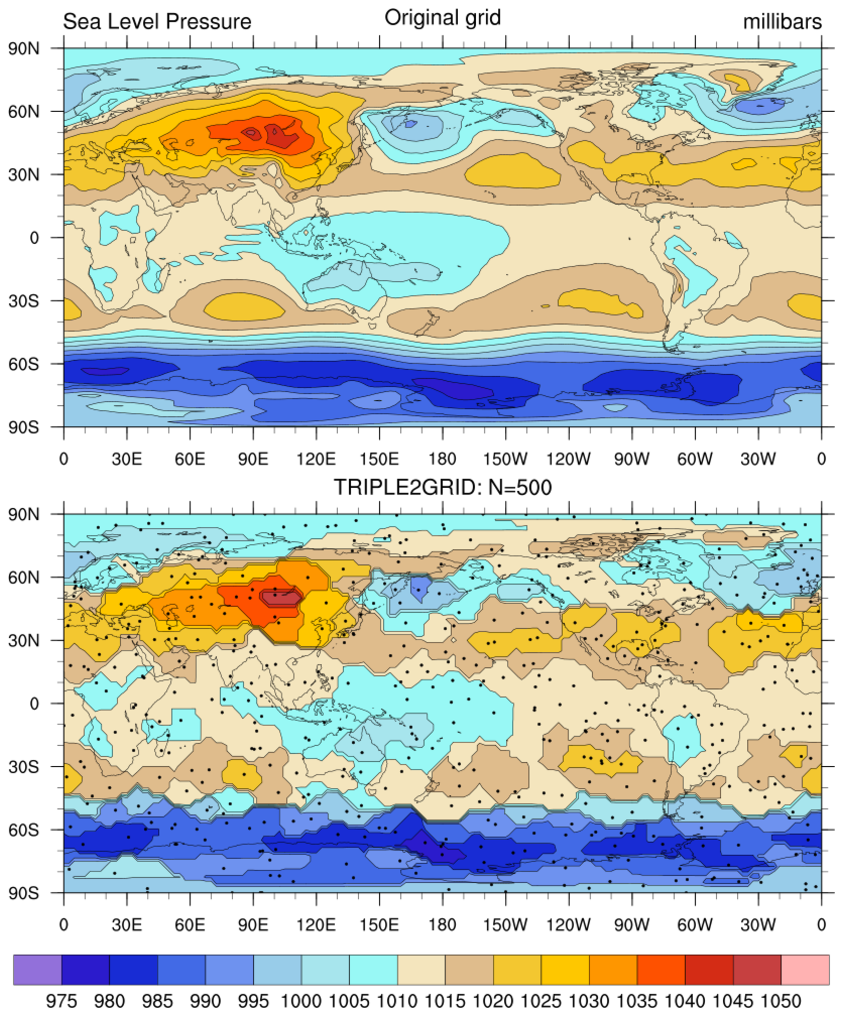
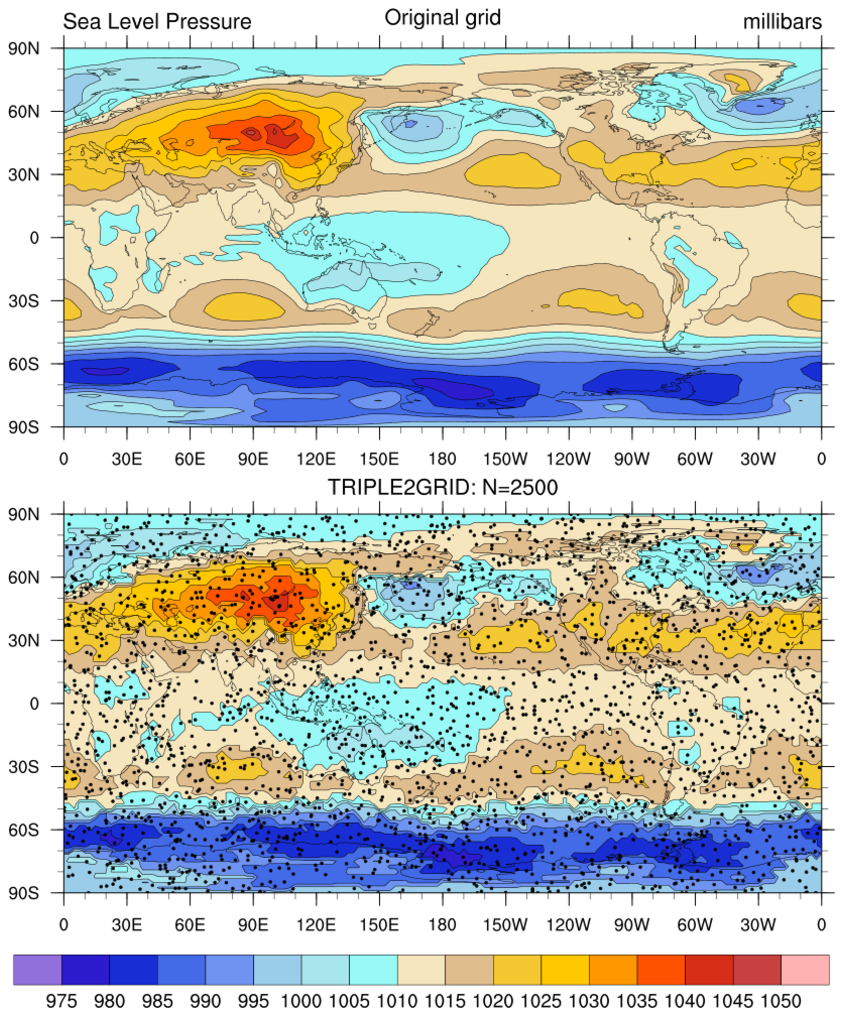
 rdm2grid_3.ncl:
Same as Example 1 except triple2grid_Wrap.
The left figure used a 'well-distributed' but very sparse (N=500)
'observation' metwork. The right figure is the same script but N=2500.
rdm2grid_3.ncl:
Same as Example 1 except triple2grid_Wrap.
The left figure used a 'well-distributed' but very sparse (N=500)
'observation' metwork. The right figure is the same script but N=2500.
 rdm2grid_4.ncl:
Same as Example 1 except obj_anal_ic_Wrap is used.
This function can be faster than the cssgrid,
triple2grid or natgrid
functions or the _Wrap versions of the functions for larger sets of data.
rdm2grid_4.ncl:
Same as Example 1 except obj_anal_ic_Wrap is used.
This function can be faster than the cssgrid,
triple2grid or natgrid
functions or the _Wrap versions of the functions for larger sets of data.
Example pages containing:
tips |
resources |
functions/procedures
Use functions to grid one-dimensional X, Y, Z (random) data
If you have X, Y, Z data represented by one-dimensional (1D) arrays of
the same length, and you can interpolate the data to a two-dimensional (2D) grid using
functions like cssgrid, natgrid and triple2grid.
 rdm2grid_1.ncl:
Gridded sea level pressures are read; then, for demonstration
purposes, NOBS are randomly sampled from the grid using
generate_unique_indices
or random_uniform and small random location
perturbations are added. The resulting lat[*], lon[*], Z[*]
triplet is then interpolated using natgrid_Wrap.
rdm2grid_1.ncl:
Gridded sea level pressures are read; then, for demonstration
purposes, NOBS are randomly sampled from the grid using
generate_unique_indices
or random_uniform and small random location
perturbations are added. The resulting lat[*], lon[*], Z[*]
triplet is then interpolated using natgrid_Wrap.
Note: The input data are on a global grid. Hence, the data are cyclic in longitude. The resulting plot clearly shows [left and right edges] that the natgrid function does not handle the cyclic situation well.
 rdm2grid_2.ncl:
Same as Example 1 except cssgrid is used to interpolate.
rdm2grid_2.ncl:
Same as Example 1 except cssgrid is used to interpolate.
Note: The input data are on a global grid. Hence, the data are cyclic in longitude. The resulting plot shows that the cssgrid_Wrap function does handle cyclic data.
 rdm2grid_3.ncl:
Same as Example 1 except triple2grid_Wrap.
The left figure used a 'well-distributed' but very sparse (N=500)
'observation' metwork. The right figure is the same script but N=2500.
rdm2grid_3.ncl:
Same as Example 1 except triple2grid_Wrap.
The left figure used a 'well-distributed' but very sparse (N=500)
'observation' metwork. The right figure is the same script but N=2500.
Given the resulting 'blocky' structure, it is suggested that the resulting grid be smoothed with (say) smth9_Wrap.
FYI: Setting opt=False would result in most grid points being set to _FillValue. This is because the number of 'observations' is small (N=500) and the number of grid points (MLON=73*144=10512) is large. Further, this option results in only observations surrounded by 4 grid points being used. In this example only 492 interpolated grid points would have a value. Punch line: only use the opt=False when there are many observations and the distribution is reasonable spaced.
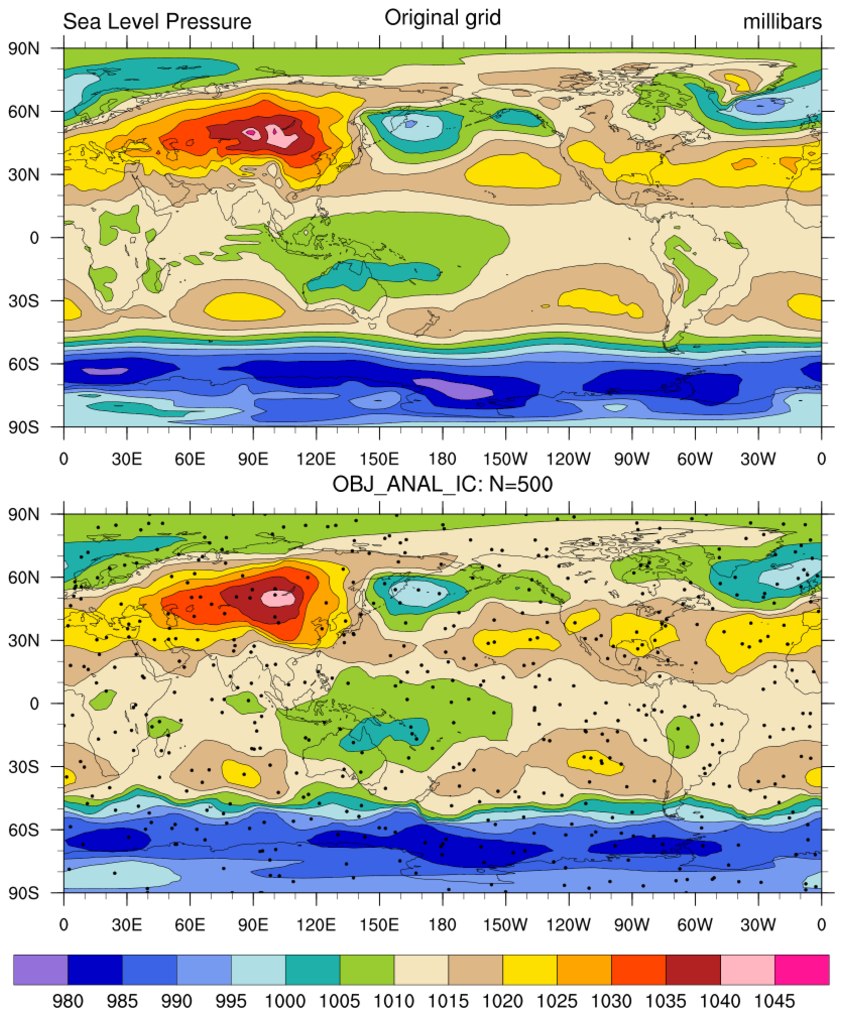
 rdm2grid_4.ncl:
Same as Example 1 except obj_anal_ic_Wrap is used.
This function can be faster than the cssgrid,
triple2grid or natgrid
functions or the _Wrap versions of the functions for larger sets of data.
rdm2grid_4.ncl:
Same as Example 1 except obj_anal_ic_Wrap is used.
This function can be faster than the cssgrid,
triple2grid or natgrid
functions or the _Wrap versions of the functions for larger sets of data.