NCL Home>
Application examples>
Plot techniques ||
Data files for some examples
Example pages containing:
tips |
resources |
functions/procedures
NCL Graphics: Resizing
There are various ways to resize an image created by NCL. It can depend
on the type of output you are sending the graphics to (PNG, PS, PDF, X11, etc).
- wkWidth
/ wkHeight - for output like
PNG and X11 window, this allows you to specify the pixel size of the
output image. Note: because NCL always draws its graphics to a square
canvas, the PNG image will be resized to a square, using the largest
of the two values, if you give it non-square values.
- wkWidthF
/ wkHeightF - for output like PS
and PDF, these are special workstation to control the size of the
paper.
- gsnPaperMargin - this resource is
only recognized by the "gsn" function, and it allows you to specify the
margin left around the page. This is useful since most postscript
printers have their own intrinsic margins. The default is 0.5.
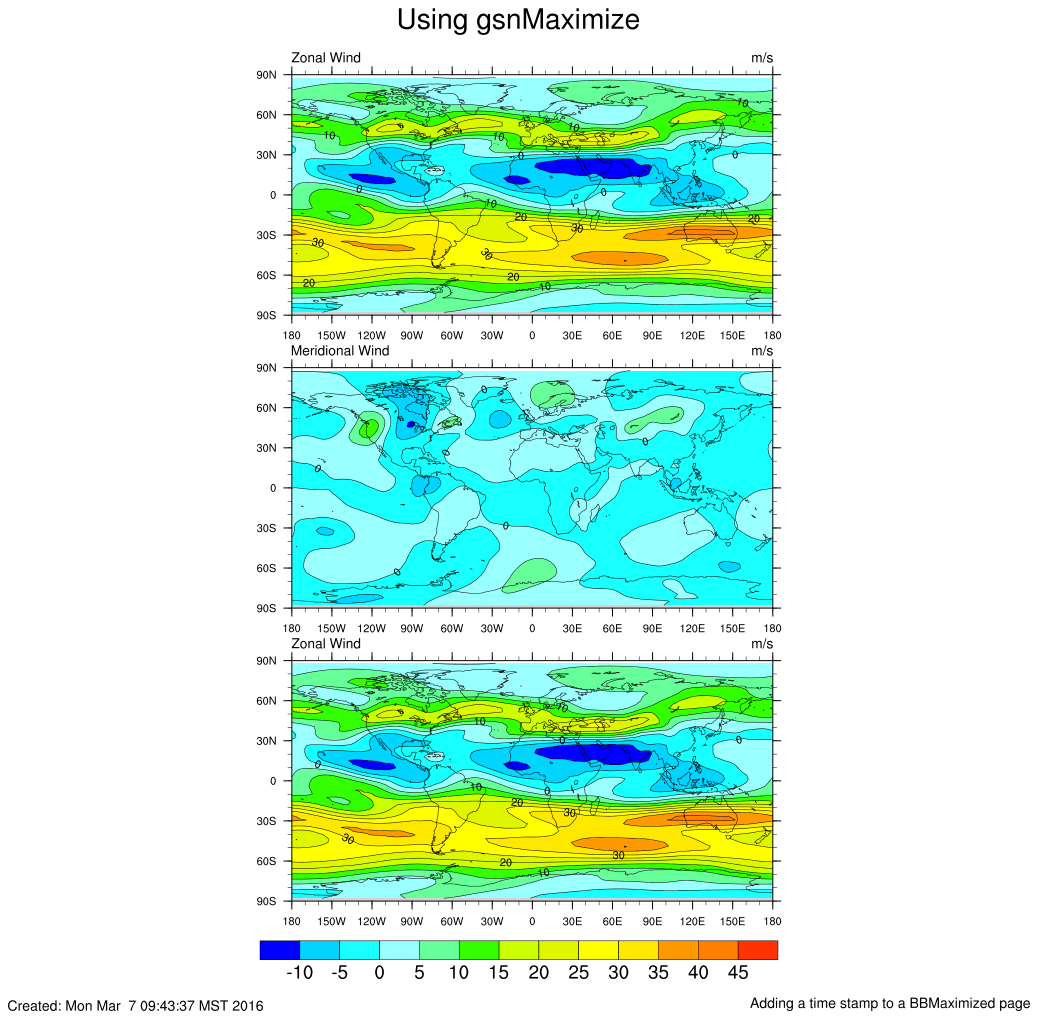
 resize_2.ncl
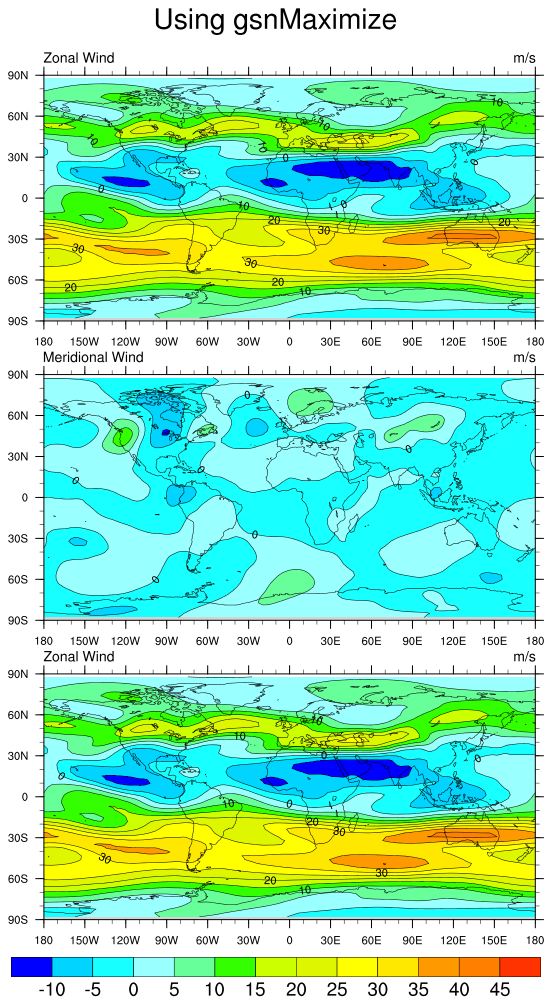
: How to add a time
stamp to a page that is maximized.
gsnMaximize, works on the entire plot.
If you try to enlarge the plot and then add text to it after the fact,
it will not see the text and only enlarge the original plot. This will
push the text off the page. We get around this by telling gsnMaximize that we anticipate placing text at
the bottom of the page by allocating space for it using gsnPanelBottom = 0.05.
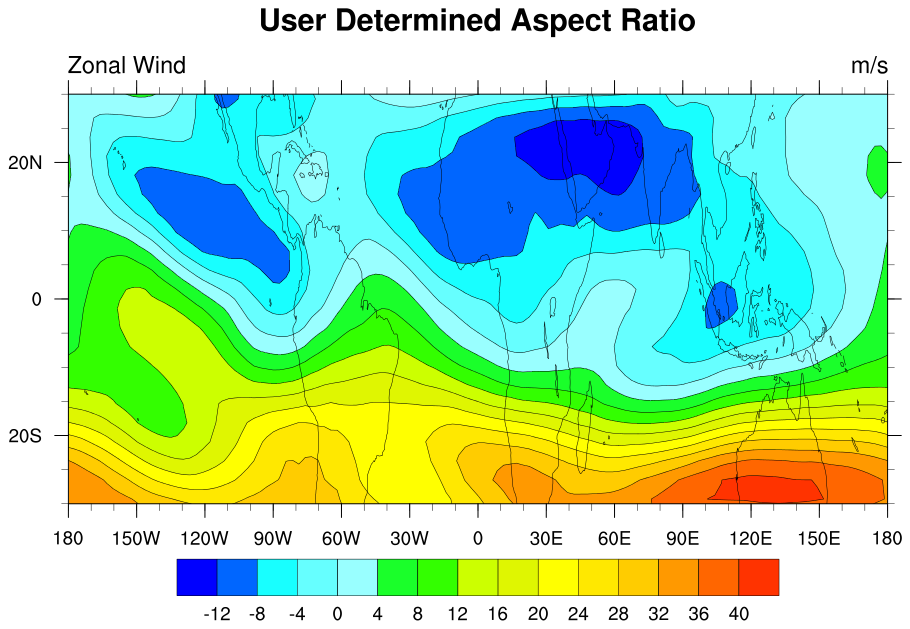
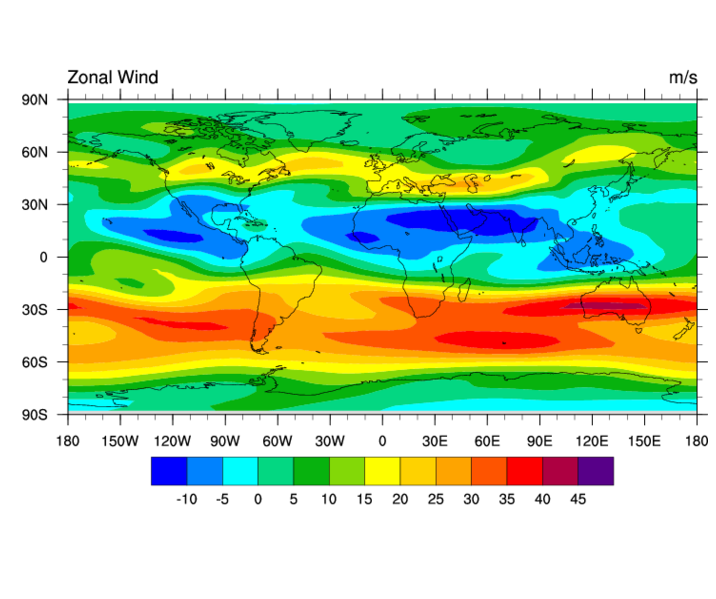
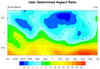 resize_3.ncl
: How to change the
aspect ratio of a map plot.
mpShapeMode = "FreeAspect"
vpWidthF = 0.8
vpHeightF = 0.4
Allows the user to change the aspect ratio of a map plot. For plain
contour plots, the ShapeMode resource is not required. For maps,
unless ShapeMode is included, the plot manager will try to maintain
the aspect ratio of the plot regardless of the values you input for
Height and Width.
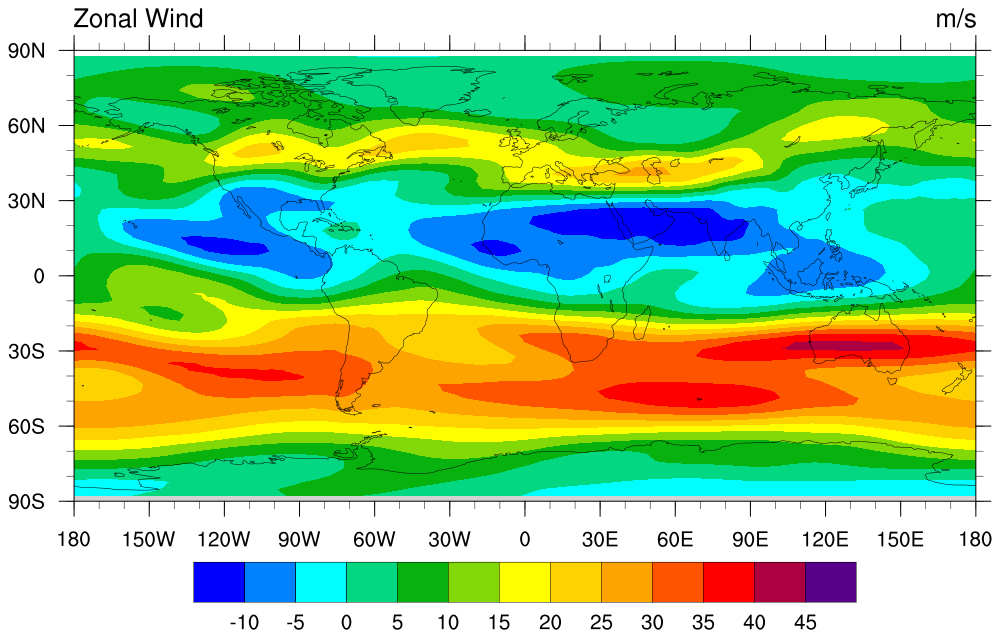
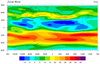 resize_4.ncl
: Creating a automatic
landscape plot.
Download ps plot with
gsnPaperOrientation = "auto"
gsnPaperOrientation allows the user to
either specify a "landscape" or "portrait" orientation. Setting this
resource to "auto" allows NCL to choose which orientation will make
the plot larger. In the case of this single cylindrical equidistant
plot, that orientation would be landscape. Note that gsnMaximize must also be set to true.
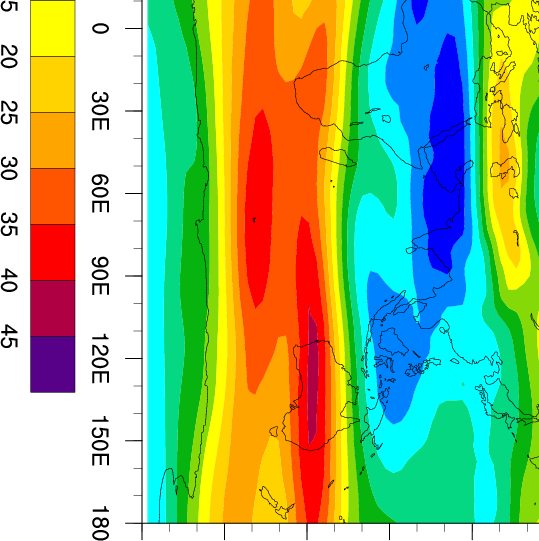
 resize_5.ncl
: Creates a plot larger
than 8.5 x 11.
gsnPaperWidth and gsnPaperHeight can be used to set the size of the
plot to any value desired.
Note about view this large ps file: You must use ghostview and use the
media pull down menu to set the page size. This will enable scroll
bars that all you to view the entire image.
You can only create large plots such as this in ".ps" mode. The
bounding box in the NCL ".eps" file is hard-wired to 8.5 x 11, and
you will not be able to view the entire image.