Example pages containing:
tips |
resources |
functions/procedures
NCL Graphics: Sea-Viewing Wide Field-of-view Sensor (SeaWiFS)
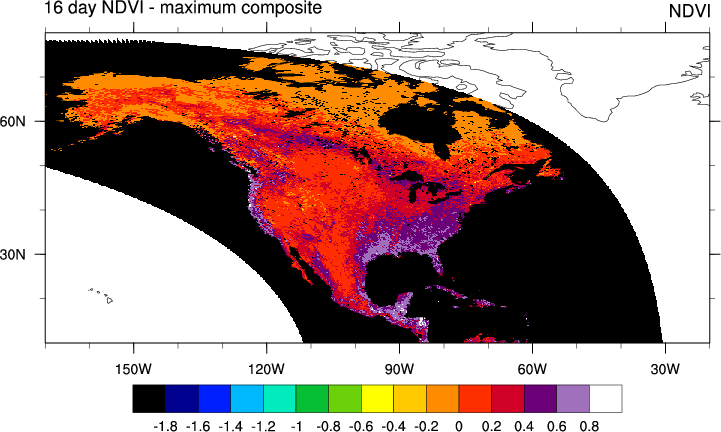
gsn_csm_contour_map_ce is
the plot interface that creates a cylindrical equidistant plot.
There is no coordinate information on the file, it has to be created. See the script for the specifics.
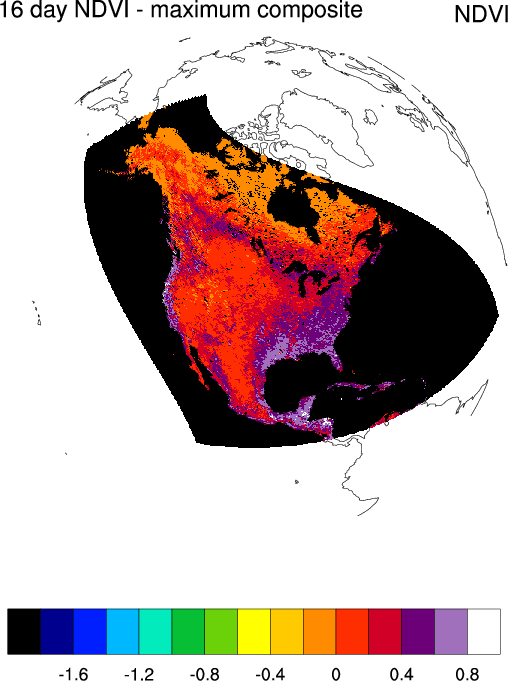 seawif_2.ncl:
The same plot as example 1, but on a satellite projection.
seawif_2.ncl:
The same plot as example 1, but on a satellite projection.
gsn_csm_contour_map is the plot interface that allows the user to select which type of projection they want. You can see more ways to modify satellite projections on the satellite projection example page
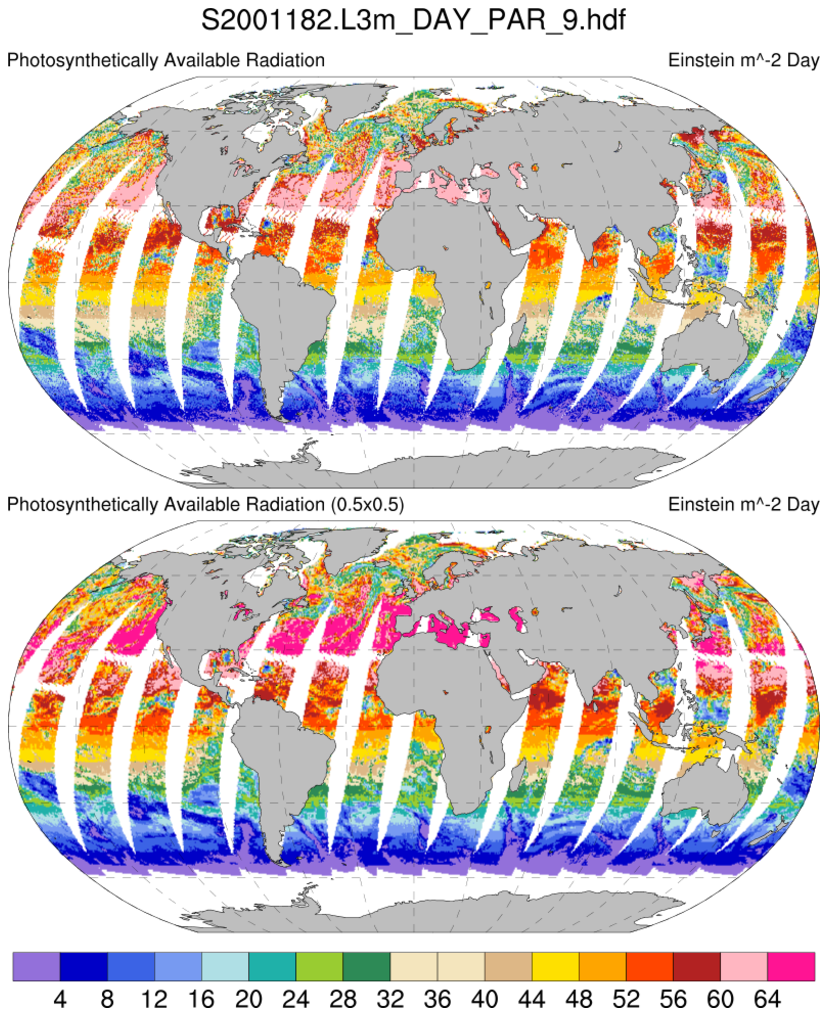 seawif_3.ncl:
Read a HDF-SDS dataset containing
SeaWiFS Level 3 Photosynthetically Active Radiation (PAR).
The file attributes contain the
geographical information and this is used to generate
coordinate variables. One issue is that the data "l3m_data"
are of type "unsigned short". These are not explicitly supported
through v5.1.1 (but will be in 5.2.0). Hence, a simple 'work-around'
is used.
seawif_3.ncl:
Read a HDF-SDS dataset containing
SeaWiFS Level 3 Photosynthetically Active Radiation (PAR).
The file attributes contain the
geographical information and this is used to generate
coordinate variables. One issue is that the data "l3m_data"
are of type "unsigned short". These are not explicitly supported
through v5.1.1 (but will be in 5.2.0). Hence, a simple 'work-around'
is used.
In addition to plotting the original 9KM data, the area_hi2lores is used to interpolate the data to a 0.5x0.5 grid. A netCDF file is created.
Other 'L3' datasets could be directly used in the sample script. For example: Example 4 on the HDF/HDF-EOS Application page.
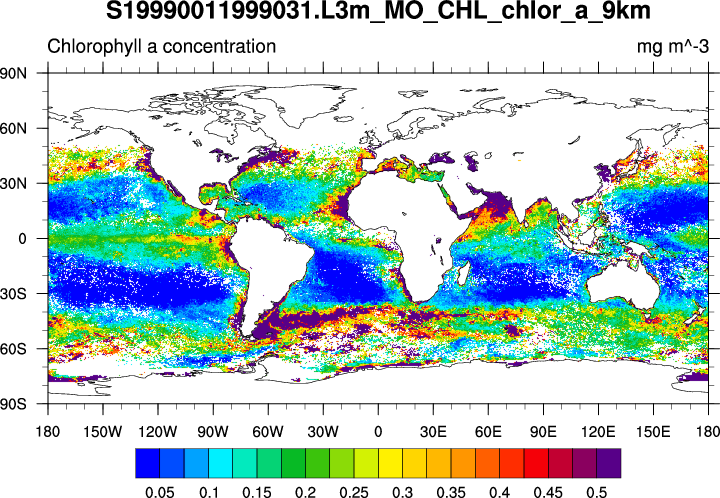 seawif_4.ncl:
Read a SeaWIFS variable and use meta data contained within the file attributes
to construct a complete (ie, self contained) variable. The initial look at the
file was via the
seawif_4.ncl:
Read a SeaWIFS variable and use meta data contained within the file attributes
to construct a complete (ie, self contained) variable. The initial look at the
file was via the Data files were obtained here.